When you first start trading, everyone faces similar questions.
Is it the right time to buy now, or should you wait? Will the current trend continue, or will it reverse soon? These decisions are not easy to make.
To help with these decisions, many traders use technical analysis.
Technical analysis is a method of understanding the market by analyzing price movements already reflected on the chart, rather than first interpreting news or economic data.
Simply put, it is an approach that uses past price behavior to assess future possibilities.
At first, it may seem difficult, but it is important to understand that technical analysis is not a tool for predicting the future with certainty—it is a process of identifying high-probability scenarios and creating a framework for decision-making.
🔹 What Is Technical Analysis
Technical analysis is a method of interpreting the market based on historical price data and chart patterns.
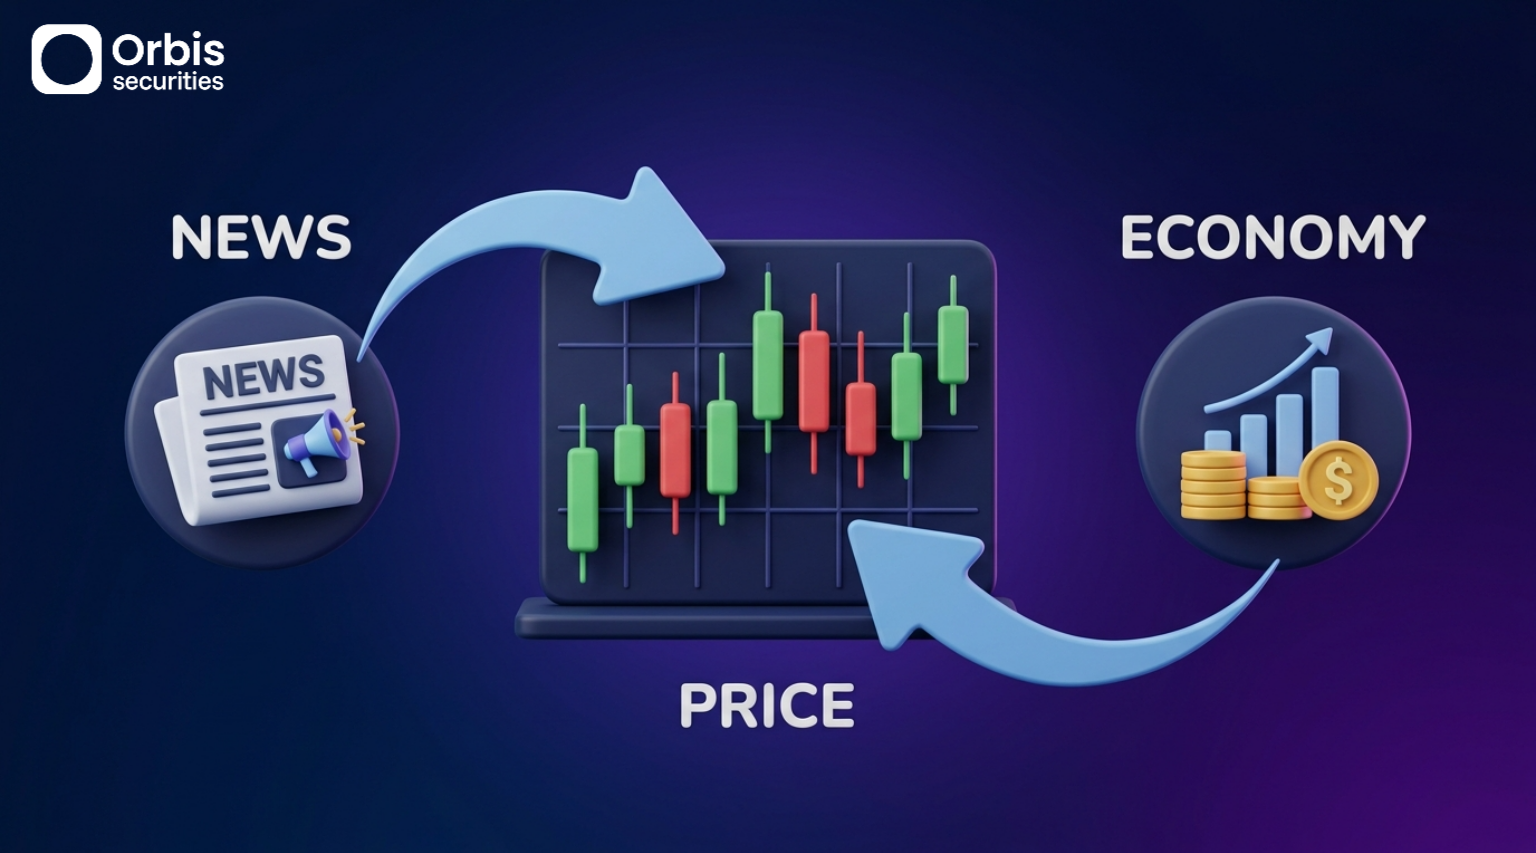
This approach is based on the idea that “all available information affecting the market is ultimately reflected in the price.”
In other words, while factors such as news, economic conditions, and interest rates are important, their impact is already incorporated into the price—so analyzing the chart itself becomes key.
For example, if the price of a currency pair continues to rise, technical analysis goes beyond simply observing that “it is going up.”
It involves asking why the trend is continuing, whether it is likely to persist, and where it might slow down or reverse.
🔹 Why Is Technical Analysis Necessary
Markets move quickly, and beginners often struggle to decide what to focus on when looking at charts, leading to emotional trading.
For example, entering a trade because “it looks like it’s going up” or “it seems like it will fall” can lead to uncertainty, especially when the price fluctuates slightly.
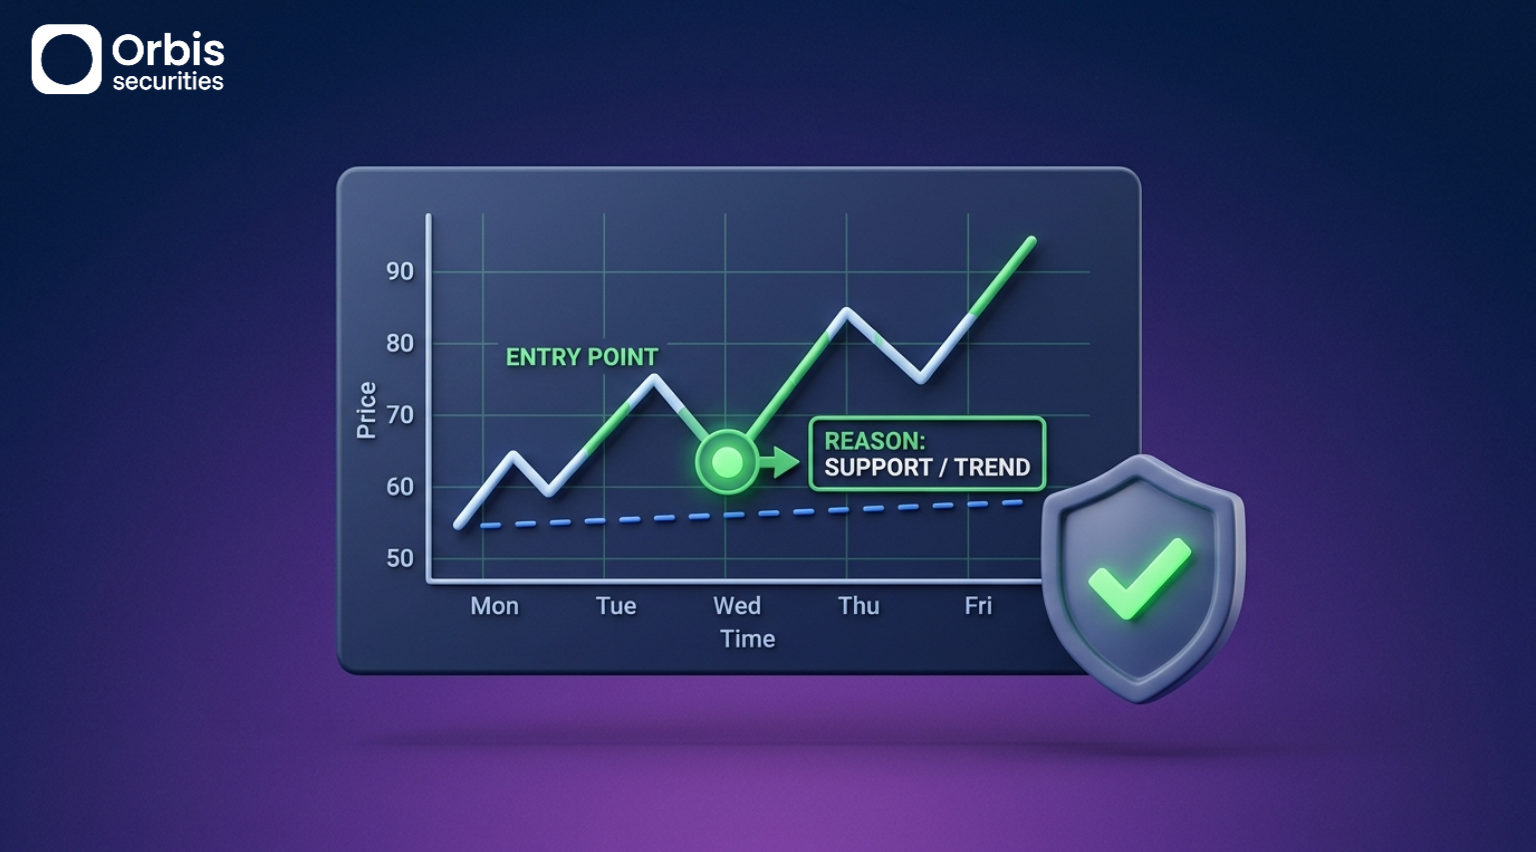
However, with technical analysis, you can trade based on clear reasoning, such as “I entered because this level is support” or “I chose to buy because the market is in an uptrend.”
In other words, technical analysis is not a tool that guarantees profit—it is a tool that helps you trade based on rules rather than emotions.
🔹 Trend: Understanding Market Direction and Momentum
The most important concept in technical analysis is the trend.
Once the market establishes a direction, it tends to continue moving in that direction—this is often referred to as “momentum.”
Charts do not always move in perfect steps, but if they form higher highs and higher lows overall, it is considered an uptrend.
If they form lower highs and lower lows, it is a downtrend.
If the price moves within a range without a clear direction, it is considered a sideways market.
For example, if EUR/USD moves from 1.1000 to 1.1050 and then to 1.1100, it can be interpreted as an uptrend.
Conversely, if it moves from 1.1100 to 1.1050 and then to 1.1000, it is a downtrend.
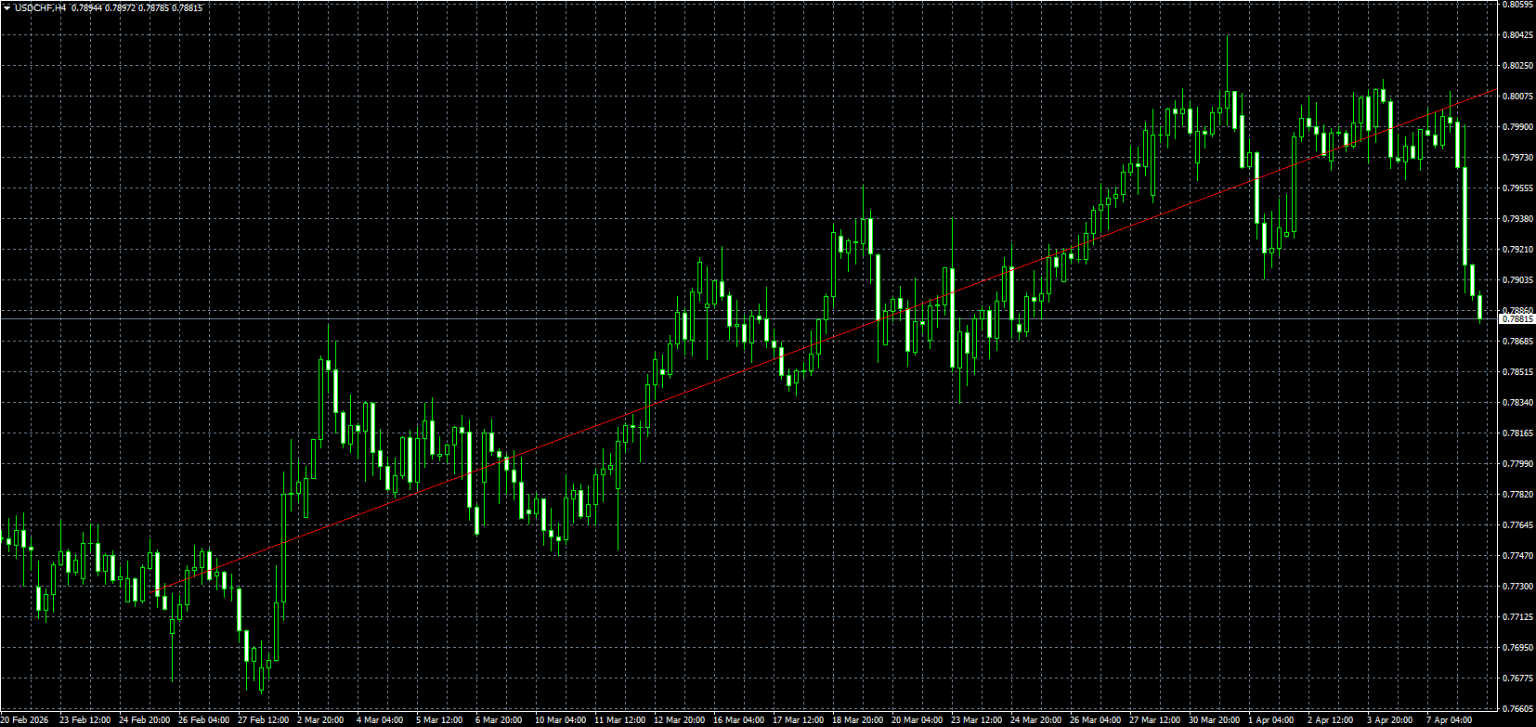
A more intuitive way to understand trends is to draw lines directly on the chart.
In an uptrend, you can connect the lows, and as long as this line holds, the upward movement is considered intact.
In a downtrend, connecting the highs helps you identify the overall direction more clearly.
🔹 Support and Resistance: Psychological Price Levels
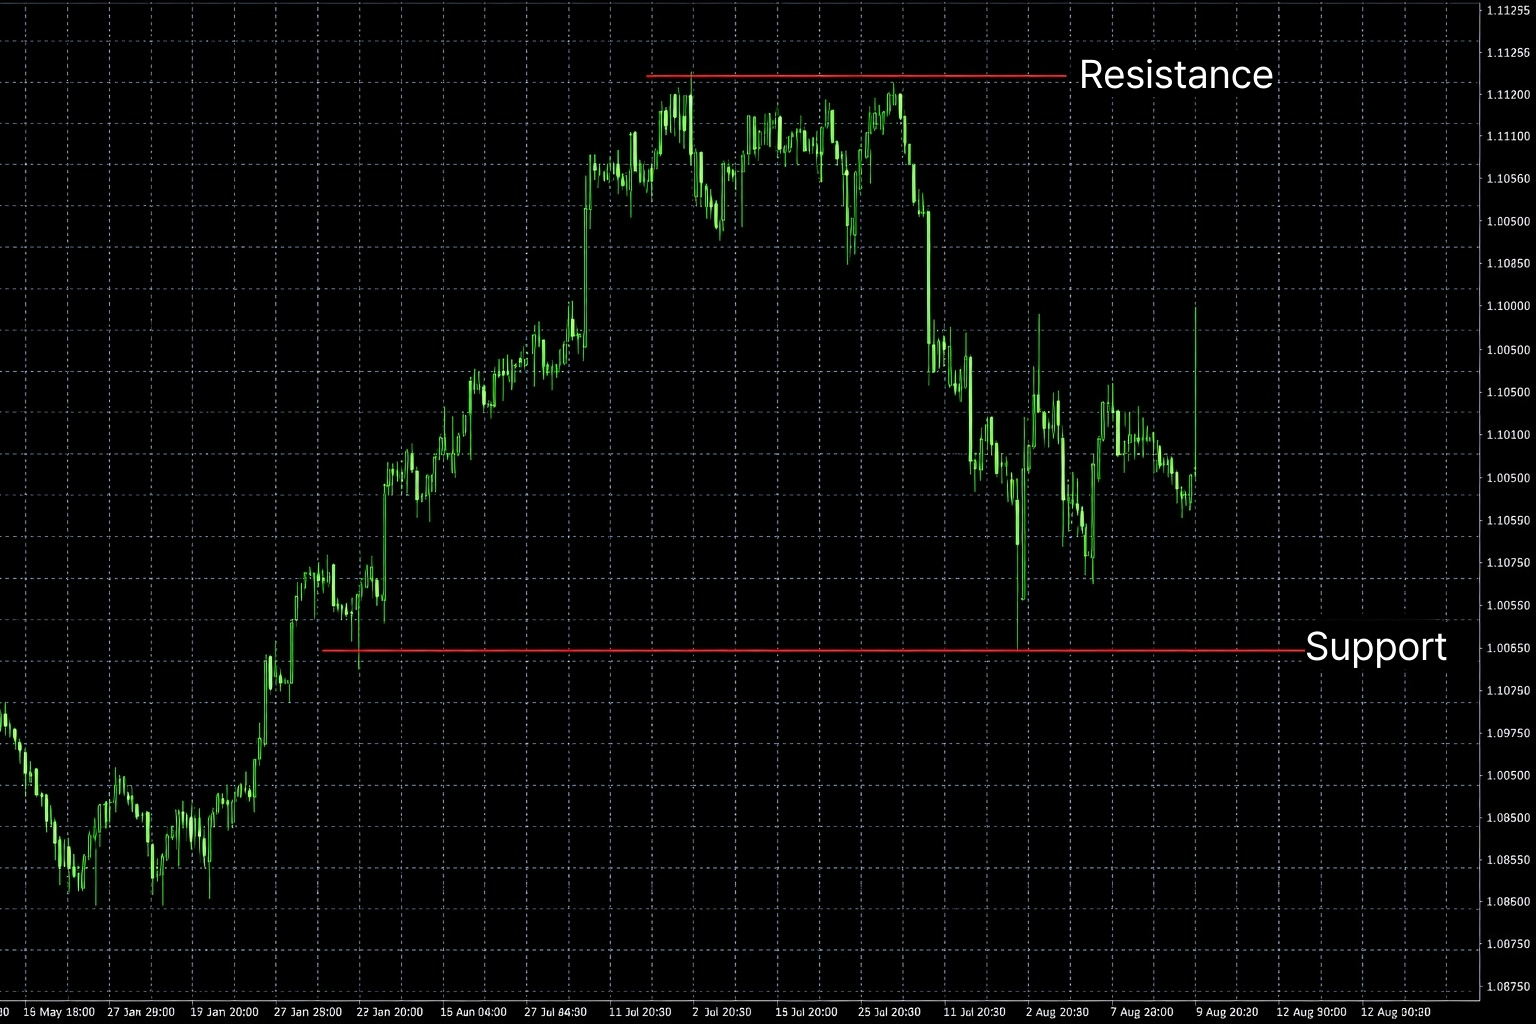
When looking at charts, you may notice that prices repeatedly bounce or get rejected at certain levels.
These are known as support and resistance levels.
Support is a level where many traders perceive the price as “cheap enough,” while resistance is where it is seen as “expensive enough.”
For example, if the price repeatedly falls to around 1.1000 and then rises again, that level can be considered support.
Conversely, if the price struggles to rise above 1.1100, that level can be considered resistance.
It is important to note that support and resistance are usually not exact lines but rather zones.
Another key concept is role reversal.
When a resistance level is broken, it often turns into support.
Conversely, when a support level is broken, it can become resistance.
However, these concepts are not absolute and should always be interpreted flexibly depending on market conditions.
🔹 Time Frame: Why the Same Market Looks Different
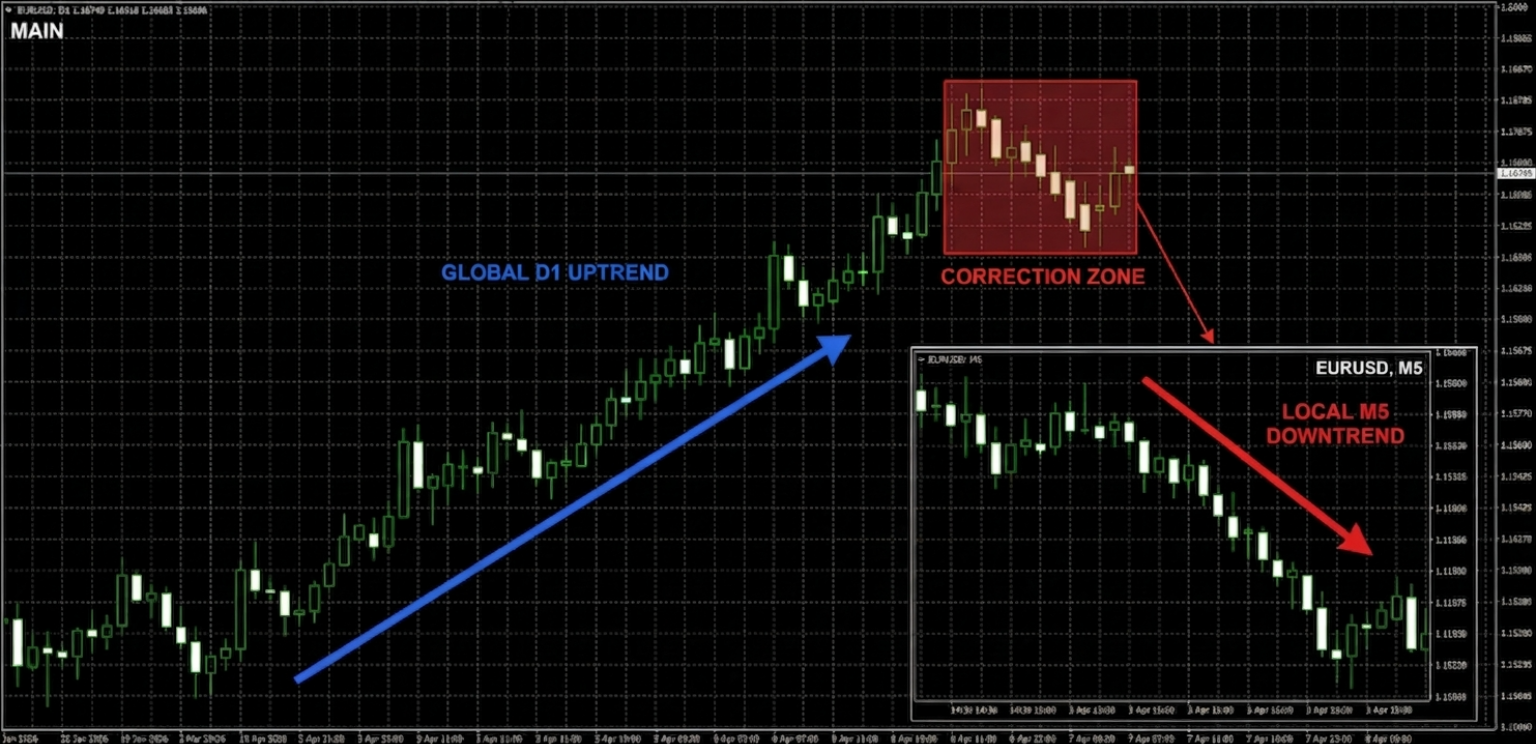
Another important concept when reading charts is the time frame.
The same market can look completely different depending on the time interval you use.
For example, on a 5-minute chart, the price may appear to be falling,
while on a 1-hour chart, it could be a temporary pullback within an uptrend,
and on a daily chart, it may simply be a minor movement within a larger upward trend.
This often leads to a common beginner mistake—buying because it looks like an uptrend, only to see the price drop immediately after entry.
In many cases, this is not due to incorrect analysis, but rather confusion between short-term and long-term perspectives.
It is helpful to start by focusing on one time frame consistently, and as you gain experience, gradually compare multiple time frames together.
🔹 Common Mistakes Beginners Make

When starting technical analysis, many people make similar mistakes.
One of the most common is trading without a clear basis.
If you do not know why you entered a trade, your results will not be consistent.
Another issue is overcomplicating the chart.
Adding too many indicators may seem helpful, but it can actually make it harder to see the essential price movement.
Trading against the trend is also a frequent mistake.
Continuously selling in an uptrend or buying in a downtrend often leads to repeated losses.
For beginners, keeping things simple and establishing clear rules is the most important approach.
🔹 Difference Between Technical and Fundamental Analysis
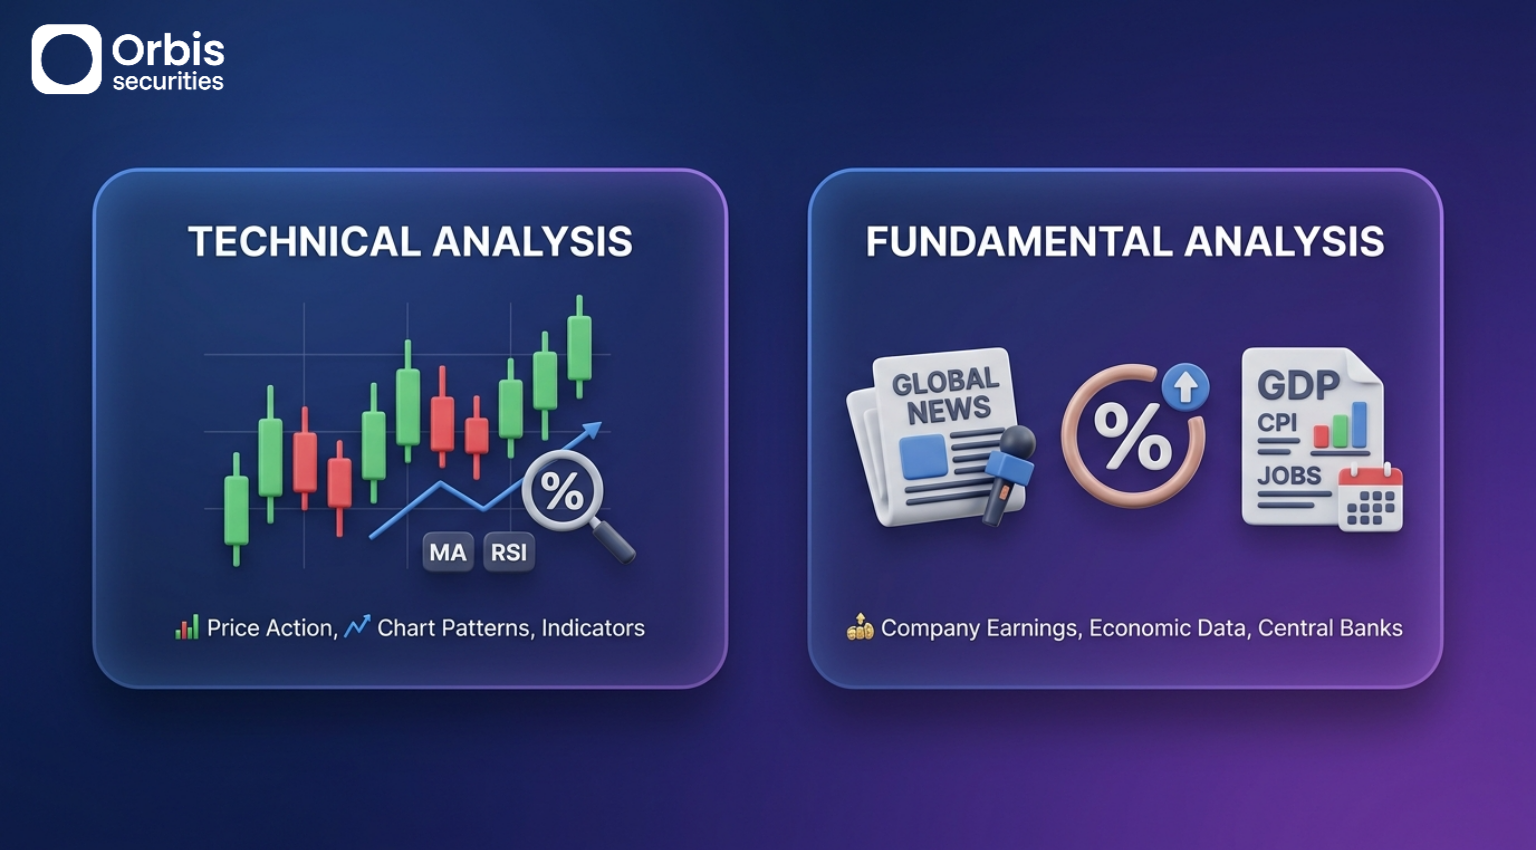
Market analysis can generally be divided into technical analysis and fundamental analysis.
Technical analysis focuses on charts and price movements,
while fundamental analysis evaluates external factors such as interest rates, economic conditions, and news.
Technical analysis allows for faster decision-making,
while fundamental analysis helps in understanding the underlying causes of market movements.
For beginners, starting with chart-based technical analysis is usually easier to understand.
🔹 Technical Analysis Is Not About Finding the “Right Answer

One important thing to remember is that technical analysis is not a tool for predicting the future with certainty.
No method can perfectly predict the market.
Technical analysis is about identifying probable scenarios and responding accordingly.
What matters is not being right every time, but having a clear plan, entering trades based on that plan, and managing losses when the market moves against you.
🔹 How Should Beginners Get Started?
There is no need to understand complex indicators or patterns from the beginning.
Start by simply looking at the chart and identifying whether the market is trending up, down, or moving sideways,
and observe where the price frequently reacts.
Understanding just these two aspects will already make charts feel much simpler.
Technical analysis is not a complicated theory—it is a basic tool for understanding market behavior and making better decisions.
It may feel unfamiliar at first, but even understanding the core concepts of trend and support/resistance can significantly change how you view the market.