Orbis Securities Logo
Orbis
Trading
Markets
Trading Platforms
Partnership
Customer Service
LoginSign Up

© 2025 Orbis Securities

Legal Information

This website is owned and operated by Orbis Securities (Pty) Ltd, a Limited Liability Company incorporated under the laws of South Africa, with registration number 2024/224812/07 and registered office address at 18 Cavendish Road, Claremont, Cape Town, Western Cape 7708, South Africa. Orbis Securities (Pty) Ltd is regulated by the Financial Sector Conduct Authority (FSCA) of South Africa with regulatory number FSP 54619.

The physical office address at Office 218, 50 Long Street, Cape Town, 8001, South Africa.

Regional Restriction

Orbis Securities (Pty) Ltd does not provide services to individuals of U.S. nationality, residents or any persons residing in jurisdictions identified as restricted or sanctioned by international regulatory authorities. Restricted countries and sanctioned jurisdictions include Afghanistan, Belarus, Cuba, Iran, Iraq, North Korea, Libya, Russia, Somalia, Syria, Ukraine, Yemen. This list is non-exhaustive and may be updated from time to time to comply with evolving international laws and regulations. Information in this website and services also not use by any person in any country or jurisdiction where such distribution or use would be contrary and deemed unlawful to local law or regulation.

Risk Warnings

Trading Derivatives carries a high level of risk to your capital, and you should only trade with money you can afford to lose. Trading Derivatives may not be suitable for all investors, so please ensure that you fully understand the risks involved and seek independent advice if necessary. For further assistance, please contact our Customer Support Team: support@orbissecurities.com or contact us at ‪+27 10 288 2018‬.

Orbis

  • About Orbis
  • Why Orbis?
  • Licenses & Regulation
  • Legal Documents

Trading

  • Account Types
  • Trading Server
  • Deposit
  • Withdrawal
  • Trading Conditions
  • Spreads
  • Swap
  • Margin & Leverage
  • Dynamic Leverage
  • Market Calendars
  • Trading Hours
  • US Earnings
  • AU Earnings

Markets

  • Forex CFDs
  • Commodity CFDs
  • Index CFDs
  • Index CFD Dividends
  • Cryptocurrency CFDs
  • Share CFDs
  • Share CFD Margins
  • Contract Specifications

Trading Platforms

  • MetaTrader 4
  • MetaTrader 5

Partnership

  • Partnership Overview
  • Partnership Benefits

Customer Service

  • Notice
  • Help & Support
  • Account Opening Guide
  • MT4 User Guide
  • MT5 User Guide
  • Economic Calendar
  • Trading Education

© 2025 Orbis Securities

Legal Information

This website is owned and operated by Orbis Securities (Pty) Ltd, a Limited Liability Company incorporated under the laws of South Africa, with registration number 2024/224812/07 and registered office address at 18 Cavendish Road, Claremont, Cape Town, Western Cape 7708, South Africa. Orbis Securities (Pty) Ltd is regulated by the Financial Sector Conduct Authority (FSCA) of South Africa with regulatory number FSP 54619.

The physical office address at Office 218, 50 Long Street, Cape Town, 8001, South Africa.

Regional Restriction

Orbis Securities (Pty) Ltd does not provide services to individuals of U.S. nationality, residents or any persons residing in jurisdictions identified as restricted or sanctioned by international regulatory authorities. Restricted countries and sanctioned jurisdictions include Afghanistan, Belarus, Cuba, Iran, Iraq, North Korea, Libya, Russia, Somalia, Syria, Ukraine, Yemen. This list is non-exhaustive and may be updated from time to time to comply with evolving international laws and regulations. Information in this website and services also not use by any person in any country or jurisdiction where such distribution or use would be contrary and deemed unlawful to local law or regulation.

Risk Warnings

Trading Derivatives carries a high level of risk to your capital, and you should only trade with money you can afford to lose. Trading Derivatives may not be suitable for all investors, so please ensure that you fully understand the risks involved and seek independent advice if necessary. For further assistance, please contact our Customer Support Team: support@orbissecurities.com or contact us at ‪+27 10 288 2018‬.

>>>Types of Trading Charts and Their Characteristics

Types of Trading Charts and Their Characteristics

Learn the differences and uses of candlestick, line, and bar charts.

April 15, 2026
image.png

When you start trading, the first thing you encounter is the chart.
A chart does not simply show whether prices go up or down—it is a tool used to understand the current market flow and direction based on past price movements.

At first, charts may seem complex, but once you understand the basic structure, they become one of the most intuitive ways to read the market.

Charts can be broadly divided into three types based on how they present data:
candlestick charts, line charts, and bar charts.


🔹 Candlestick Chart: Showing Both Market Flow and Sentiment
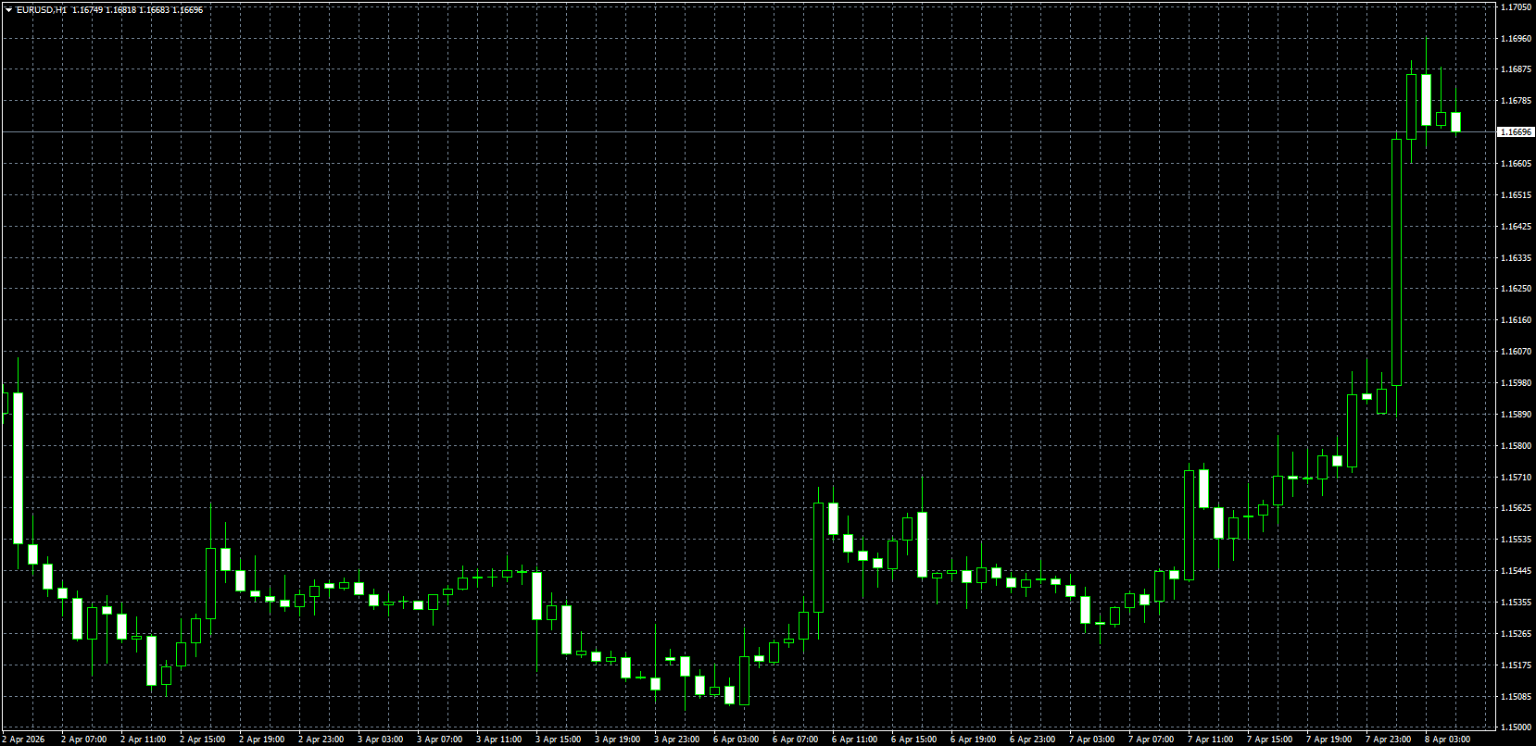
image.png

The candlestick chart is the most widely used chart type today and is the standard for both beginners and professional traders.

Each candlestick represents price movement over a specific period of time.
For example, on a 1-hour chart, one candle represents one hour, while the timeframe can vary (e.g., 5 minutes, 15 minutes, 1 hour, 1 day).

This is called the time frame.
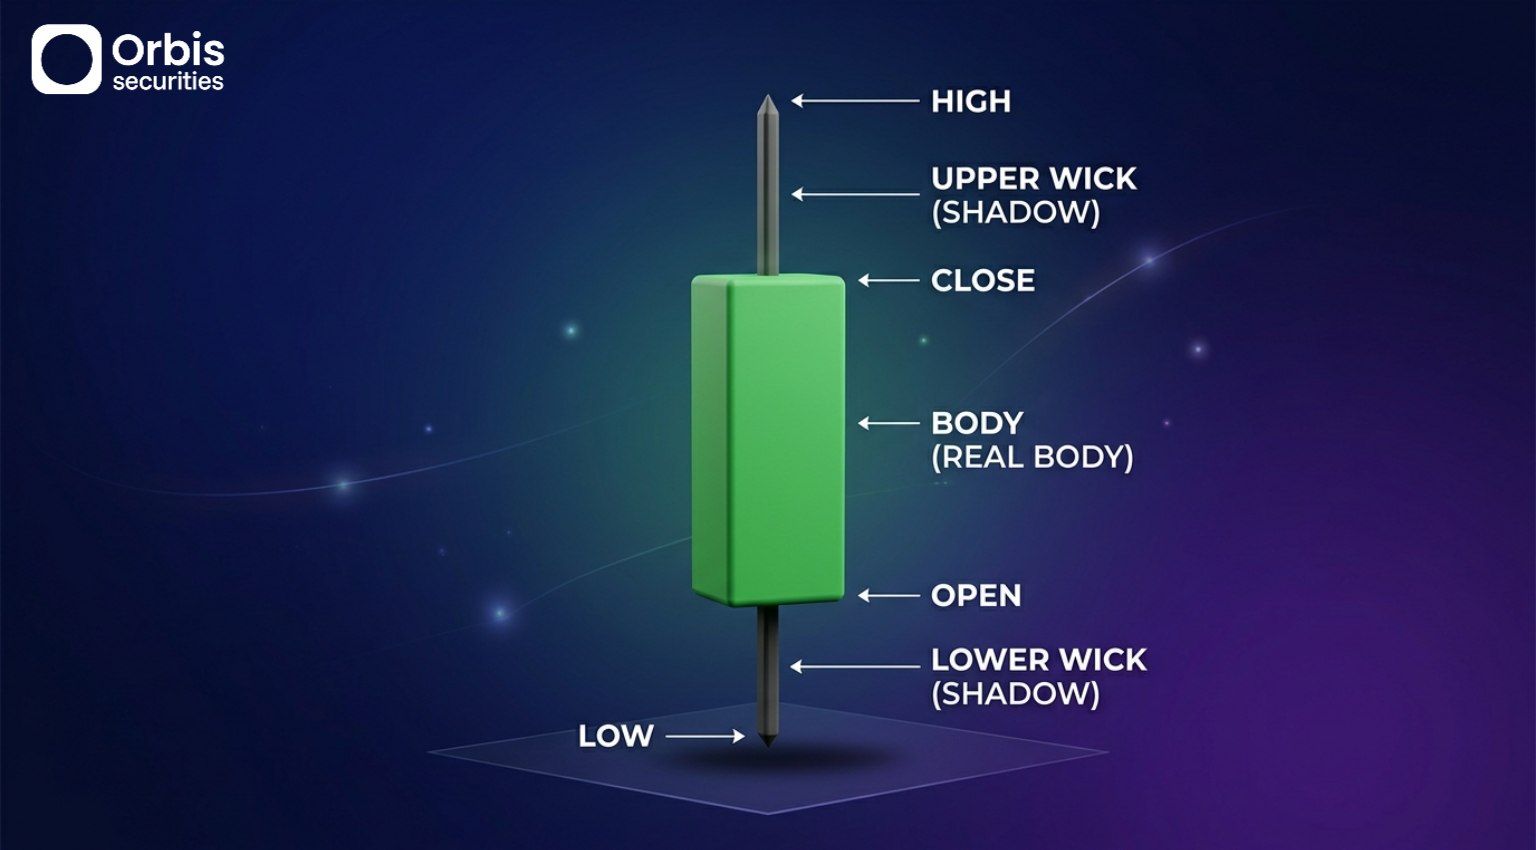
image.png

Each candlestick contains four key pieces of information:
the opening price, closing price, highest price, and lowest price.

The thick part of the candle is called the body, representing the difference between the opening and closing prices.
The longer the body, the stronger the price movement during that period.

The thin lines extending above and below the body are called wicks, indicating that the price moved to those levels but then pulled back.
This can be interpreted as a sign of strong interaction between buyers and sellers, and longer wicks generally indicate higher volatility.

If the closing price is higher than the opening price, it is shown as a bullish candle; if lower, it is a bearish candle.

Typically, bullish candles are displayed in green and bearish candles in red, although colors may vary depending on the platform.
It is important to focus on the price structure rather than the color itself.

Additionally, periods where prices move significantly in a short time indicate high volatility, which may reflect active market participation or strong competition between buyers and sellers.


🔹 Line Chart: The Simplest Way to View Trends
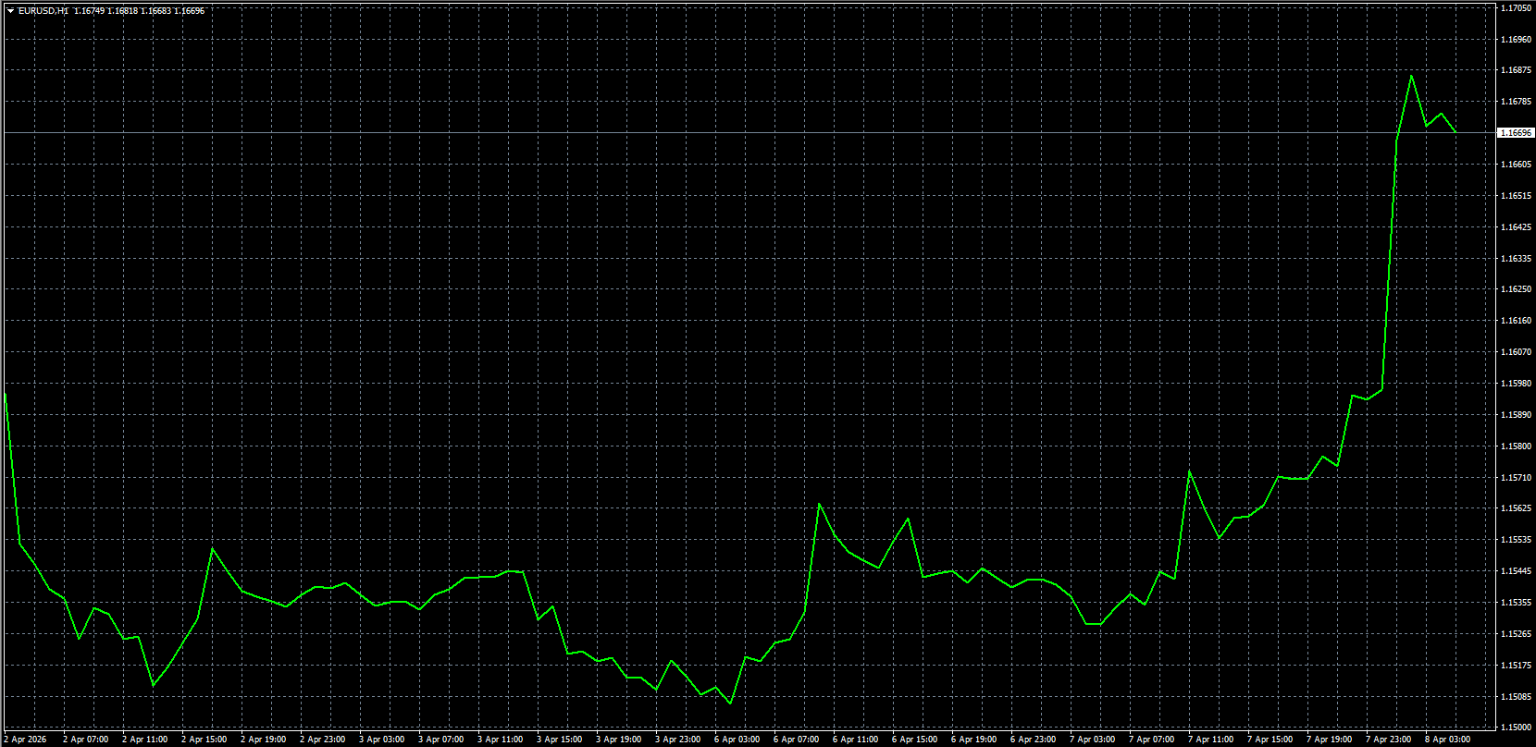
image.png

A line chart is the simplest form of chart, usually created by connecting the closing prices of each time period.

Unlike candlestick charts, it excludes high and low price movements and focuses only on where the price ended.

Because unnecessary details are removed, this chart is very useful for quickly identifying the overall direction of the market.
You can easily see whether the market is in an uptrend, downtrend, or moving sideways.

However, since it does not show detailed price movements, it is better suited as a supplementary tool for understanding broader trends rather than for executing trades.


🔹 Bar Chart: A Structure-Focused Chart with OHLC Data
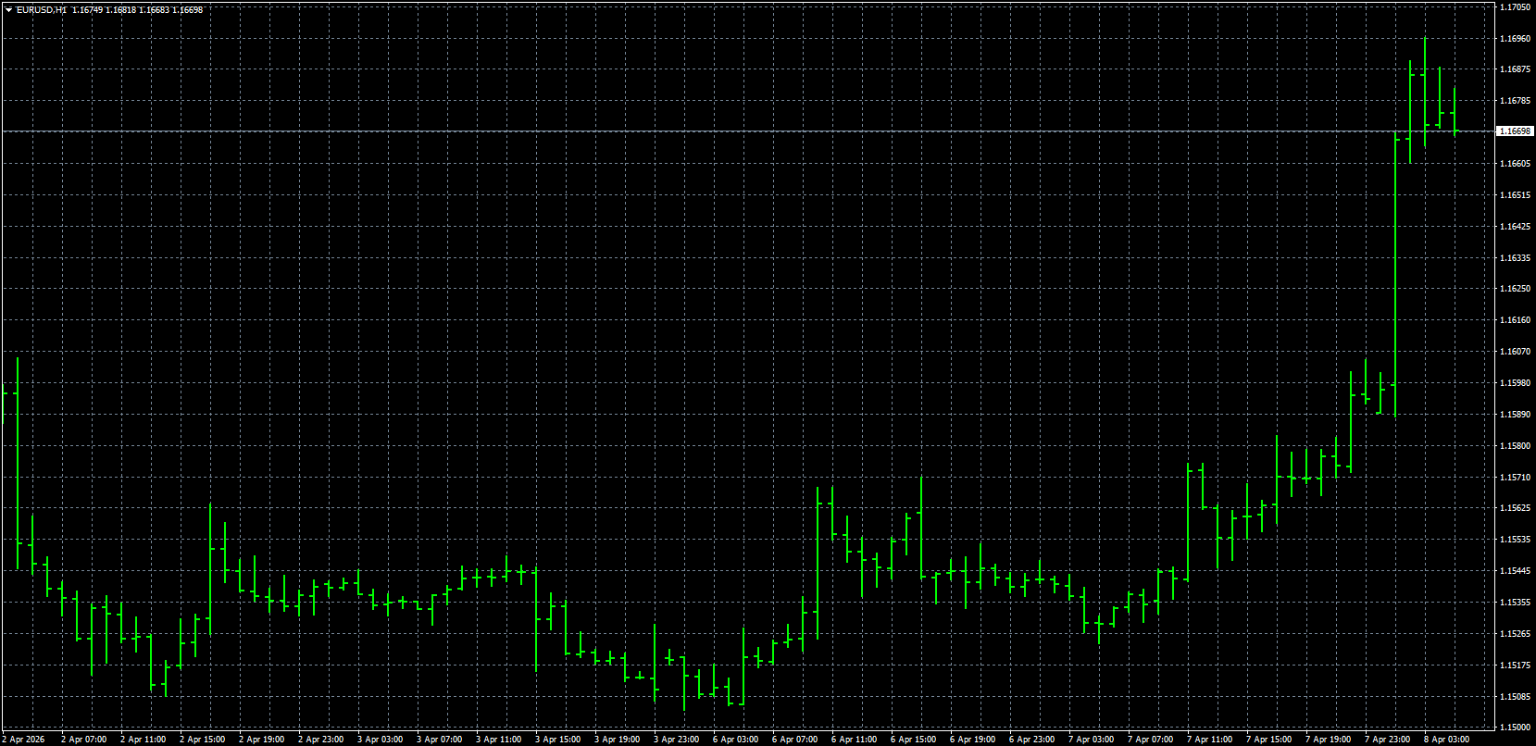
image.png

A bar chart includes all four price elements—Open, High, Low, and Close—and is therefore also called an OHLC chart.

Each bar represents a specific time period.
The top of the bar indicates the high price, and the bottom indicates the low price.
A small horizontal line extending to the left shows the opening price, while a line to the right shows the closing price.

In other words, it contains the same information as a candlestick chart but presents it in a different format.
You can think of candlestick charts as a more visually intuitive version of bar charts.

While bar charts accurately display price structure, they may feel less intuitive visually compared to candlestick charts, making them slightly more challenging for beginners.


🔹 Which Chart Should You Use?
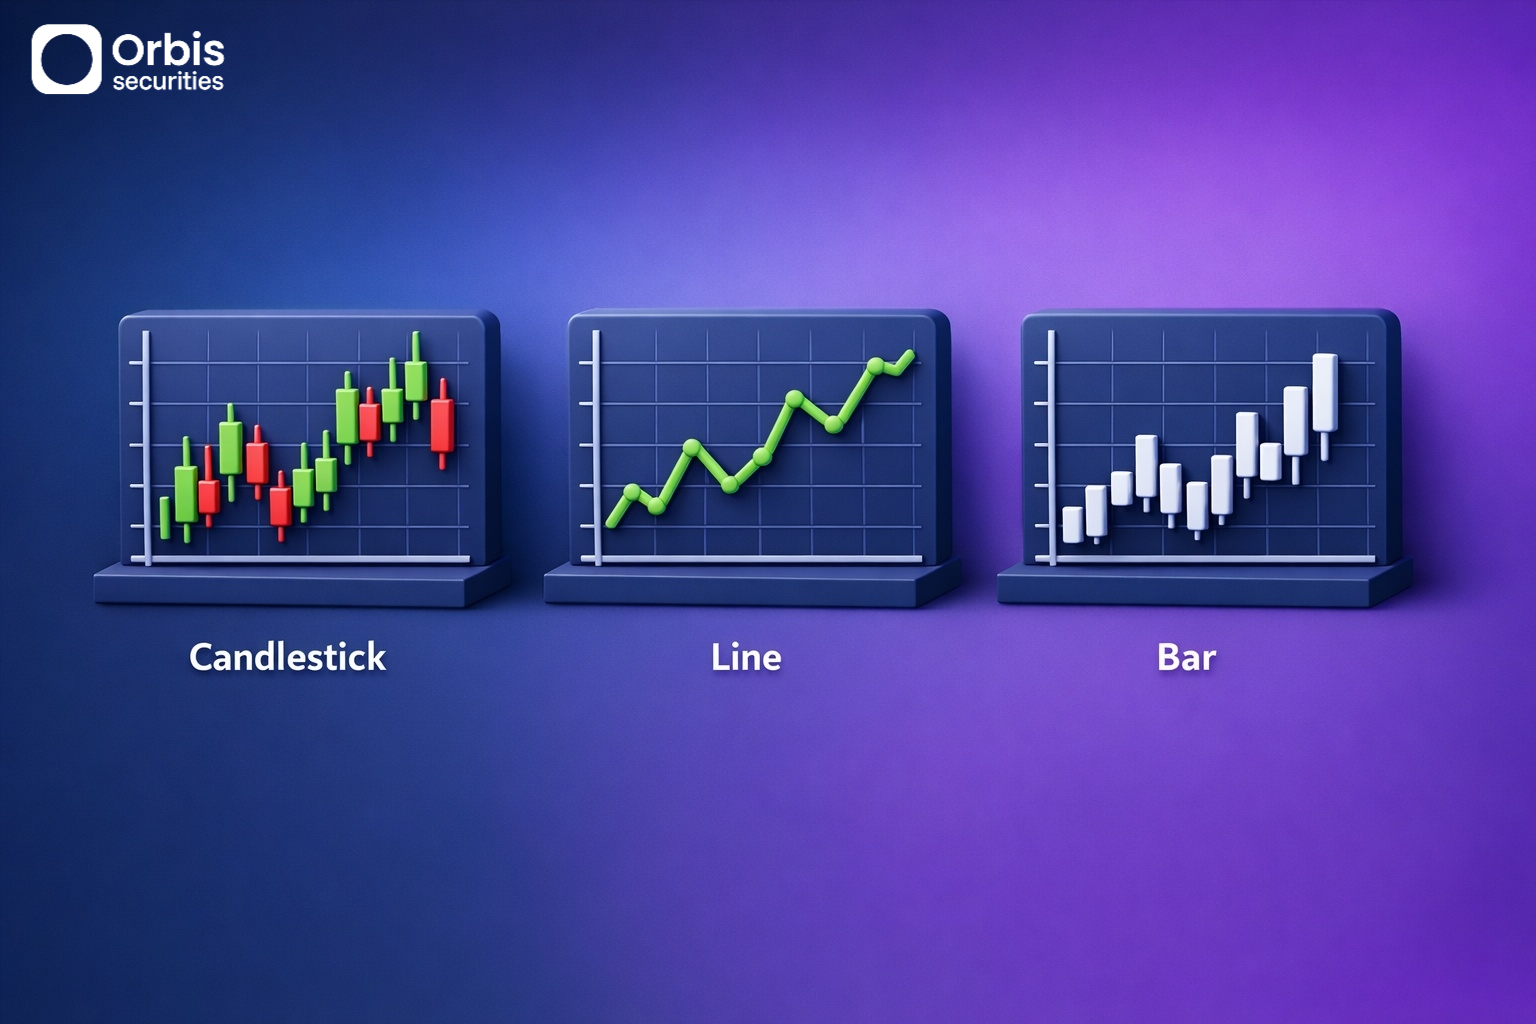
image.png

For beginners, it is best to start with candlestick charts.

Candlestick charts display both price information and market flow, making them the easiest and most versatile option when learning how to read charts.

Line charts are useful as a supplementary tool for quickly identifying overall trends,
while bar charts can be used as a reference once you become more familiar with candlestick charts.


🔹 Key Points to Focus on When Reading Charts

When first learning to read charts, it is more important to focus on the following three aspects rather than complex patterns or indicators:

- Whether the overall price is trending upward or downward
- Where the price frequently stops or reacts
- Whether recent price movements are strong or weak


Understanding just these three points provides a solid foundation for reading charts.

A chart is not just a visual representation—it is a tool for understanding market flow and sentiment.
Once you understand the basic structure, price movements will gradually become clearer and easier to interpret.​