Orbis Securities Logo
Orbis
Trading
Markets
Trading Platforms
Partnership
Customer Service
LoginSign Up

© 2025 Orbis Securities

Legal Information

This website is owned and operated by Orbis Securities (Pty) Ltd, a Limited Liability Company incorporated under the laws of South Africa, with registration number 2024/224812/07 and registered office address at 18 Cavendish Road, Claremont, Cape Town, Western Cape 7708, South Africa. Orbis Securities (Pty) Ltd is regulated by the Financial Sector Conduct Authority (FSCA) of South Africa with regulatory number FSP 54619.

The physical office address at Office 218, 50 Long Street, Cape Town, 8001, South Africa.

Regional Restriction

Orbis Securities (Pty) Ltd does not provide services to individuals of U.S. nationality, residents or any persons residing in jurisdictions identified as restricted or sanctioned by international regulatory authorities. Restricted countries and sanctioned jurisdictions include Afghanistan, Belarus, Cuba, Iran, Iraq, North Korea, Libya, Russia, Somalia, Syria, Ukraine, Yemen. This list is non-exhaustive and may be updated from time to time to comply with evolving international laws and regulations. Information in this website and services also not use by any person in any country or jurisdiction where such distribution or use would be contrary and deemed unlawful to local law or regulation.

Risk Warnings

Trading Derivatives carries a high level of risk to your capital, and you should only trade with money you can afford to lose. Trading Derivatives may not be suitable for all investors, so please ensure that you fully understand the risks involved and seek independent advice if necessary. For further assistance, please contact our Customer Support Team: support@orbissecurities.com or contact us at ‪+27 10 288 2018‬.

Orbis

  • About Orbis
  • Why Orbis?
  • Licenses & Regulation
  • Legal Documents

Trading

  • Account Types
  • Trading Server
  • Deposit
  • Withdrawal
  • Trading Conditions
  • Spreads
  • Swap
  • Margin & Leverage
  • Dynamic Leverage
  • Market Calendars
  • Trading Hours
  • US Earnings
  • AU Earnings

Markets

  • Forex CFDs
  • Commodity CFDs
  • Index CFDs
  • Index CFD Dividends
  • Cryptocurrency CFDs
  • Share CFDs
  • Share CFD Margins
  • Contract Specifications

Trading Platforms

  • MetaTrader 4
  • MetaTrader 5

Partnership

  • Partnership Overview
  • Partnership Benefits

Customer Service

  • Notice
  • Help & Support
  • Account Opening Guide
  • MT4 User Guide
  • MT5 User Guide
  • Economic Calendar
  • Trading Education

© 2025 Orbis Securities

Legal Information

This website is owned and operated by Orbis Securities (Pty) Ltd, a Limited Liability Company incorporated under the laws of South Africa, with registration number 2024/224812/07 and registered office address at 18 Cavendish Road, Claremont, Cape Town, Western Cape 7708, South Africa. Orbis Securities (Pty) Ltd is regulated by the Financial Sector Conduct Authority (FSCA) of South Africa with regulatory number FSP 54619.

The physical office address at Office 218, 50 Long Street, Cape Town, 8001, South Africa.

Regional Restriction

Orbis Securities (Pty) Ltd does not provide services to individuals of U.S. nationality, residents or any persons residing in jurisdictions identified as restricted or sanctioned by international regulatory authorities. Restricted countries and sanctioned jurisdictions include Afghanistan, Belarus, Cuba, Iran, Iraq, North Korea, Libya, Russia, Somalia, Syria, Ukraine, Yemen. This list is non-exhaustive and may be updated from time to time to comply with evolving international laws and regulations. Information in this website and services also not use by any person in any country or jurisdiction where such distribution or use would be contrary and deemed unlawful to local law or regulation.

Risk Warnings

Trading Derivatives carries a high level of risk to your capital, and you should only trade with money you can afford to lose. Trading Derivatives may not be suitable for all investors, so please ensure that you fully understand the risks involved and seek independent advice if necessary. For further assistance, please contact our Customer Support Team: support@orbissecurities.com or contact us at ‪+27 10 288 2018‬.

>>>How to Draw Support and Resistance + Practical Tips

How to Draw Support and Resistance + Practical Tips

Learn how to use horizontal levels and trendlines to find entry and exit timing.

April 17, 2026
image.png

Price does not move randomly up or down.

Instead, it repeatedly pauses at certain levels and then changes direction—these points are known as support and resistance.
These levels are not just lines, but areas where buying and selling pressure collide and reach equilibrium.

Support and resistance represent price zones where market expectations and psychology are concentrated, serving as key reference points for traders when deciding entries and exits.

Ultimately, understanding these levels means understanding why price stops and where it is likely to move next.


🔹 Meaning of Support and Resistance

A support level is a price zone where a decline stops and price rebounds, indicating that buying pressure is entering the market at that level.
Market participants tend to perceive this zone as relatively “cheap,” prompting renewed buying activity.

On the other hand, a resistance level is where price rises but fails to move higher and reverses, reflecting strong selling pressure.
At this level, traders often take profits, creating downward pressure on price.

In this sense, support and resistance are not just technical tools but psychological price zones formed by repeated market behavior.


🔹 The Significance of Repeated Price Levels

Support and resistance become stronger because similar reactions occur repeatedly at specific price levels.

If price consistently stops or reverses at the same zone, it indicates that many participants are using that level as a reference point.

A key concept is role reversal.
A resistance level that gets broken can later act as support, while a broken support level can turn into resistance.

This shift signals a structural change in the market and is an important clue for traders.


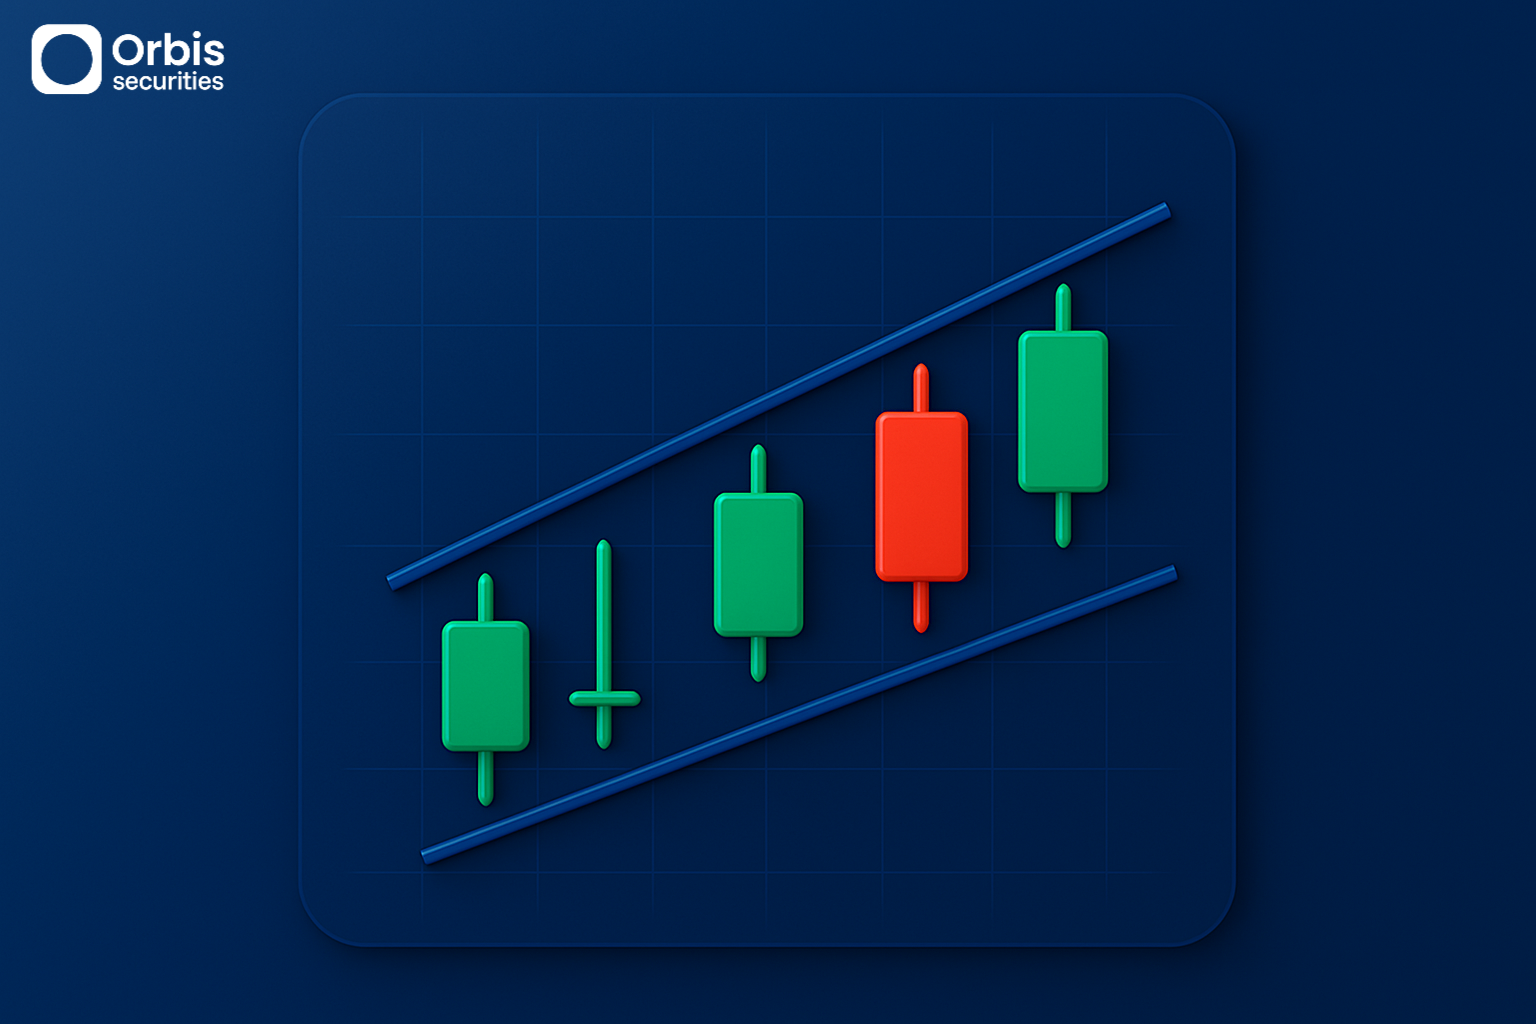
🔹 What Trendlines Reveal

image.png

If support and resistance represent horizontal levels, trendlines reflect the market’s direction and momentum.

In an uptrend, higher lows form a rising slope, while in a downtrend, lower highs create a downward slope.

Trendlines visually show the rhythm of the market, and each time price approaches the line, a new balance between buyers and sellers tends to form.

As long as the trendline holds, the existing trend is likely to continue.
However, when the line breaks, it can signal a potential shift in market direction.


🔹 Combining Levels with Market Reaction

Support and resistance levels are not complete signals on their own—they gain meaning based on how price reacts at those zones.

Even at the same support level, a strong bounce and a weak breakdown require completely different interpretations.

Candlestick patterns and trading volume at these levels provide important clues.

A strong move in a short time suggests clear dominance of one side, while a weak reaction may indicate that the level is losing its influence.

Additionally, when price breaks a level and then returns to retest it, this often forms a new support or resistance zone and can be used as a relatively reliable entry point.


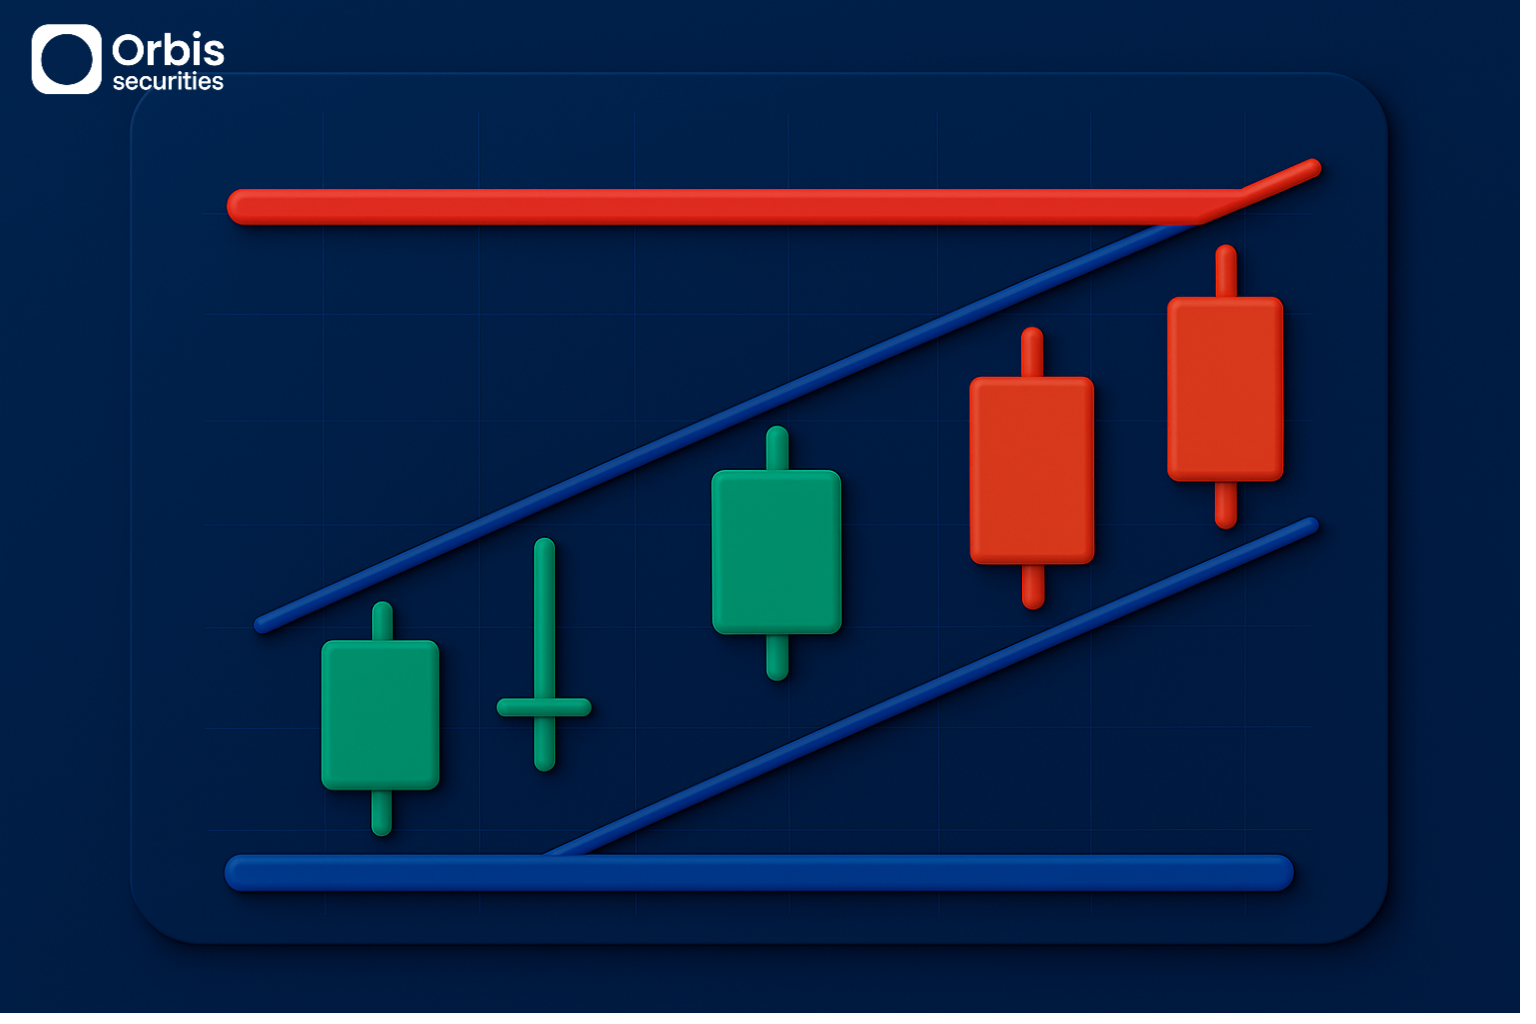
🔹 When the Existing Interpretation Breaks Down

Support and resistance are not absolute rules that always hold.

When a level is decisively broken, the previous balance is disrupted and a new market structure begins to form.

If price firmly holds below a support level or breaks above resistance without pulling back, it is important to shift perspective rather than relying on the old interpretation.

These moments often serve as critical points for closing positions or reassessing market direction.​