Even when price moves within a narrowing range, if the trendlines are both sloping in the same direction, it is not just a simple consolidation—it is considered a wedge pattern.
This structure shows that market energy is leaning in one direction while gradually weakening at the same time.
Although the trend may appear to continue on the surface, internally the balance of power is slowly shifting.
At the end of this process, the market may either reverse or, in some cases, continue the existing trend with renewed strength.
🔹 Structure of a Wedge Pattern
A wedge pattern forms when two trendlines slope in the same direction while gradually converging.
Unlike triangle patterns, where the upper and lower boundaries move in different directions, both boundaries in a wedge move in the same direction.
However, due to differences in slope, the price range becomes increasingly compressed.
The key aspect here is not just the shape, but the change in momentum.
Even though price continues to rise or fall, the magnitude of movement decreases over time, signaling that the strength of the trend is weakening.
🔹 Difference Between Rising and Falling Wedges
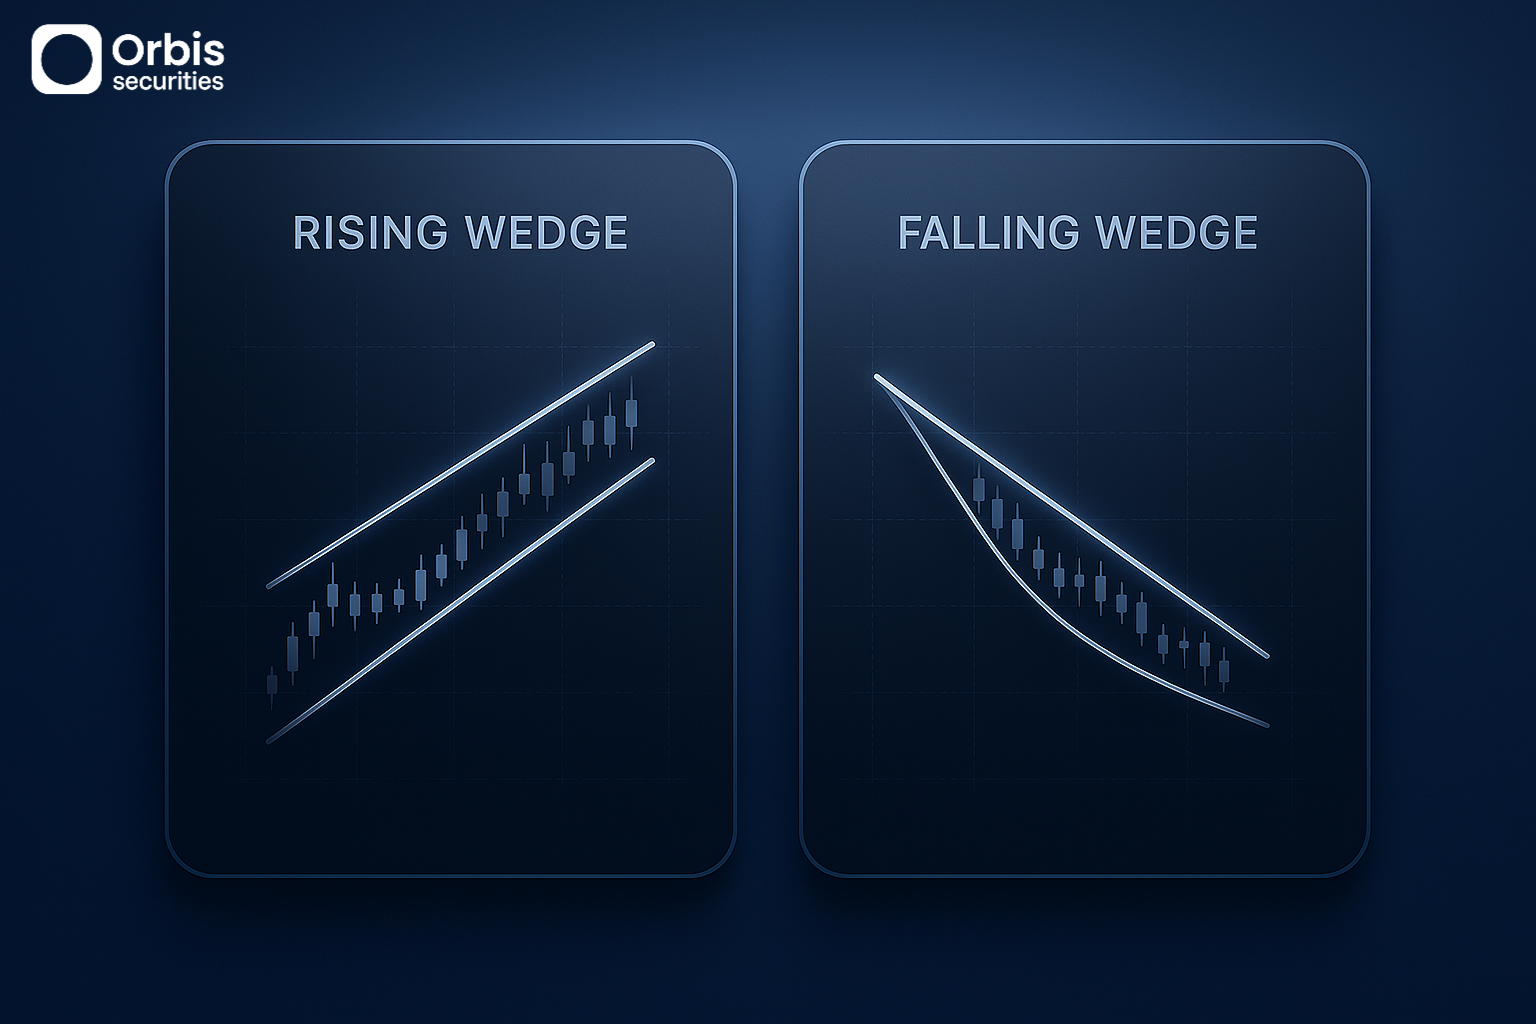
A rising wedge forms during an uptrend, where both highs and lows increase, but the rate of upward movement slows down.
While the market appears to be trending higher, buying pressure is gradually losing strength.
In this case, once the lower trendline breaks, the uptrend is likely to end, increasing the probability of a downward reversal.
On the other hand, a falling wedge forms during a downtrend, where both highs and lows decrease, but the rate of decline slows.
This suggests that selling pressure is weakening.
When the upper trendline is broken, it often signals a potential rebound or a transition into an uptrend.
🔹 The Meaning of a Breakout
The most critical moment in a wedge pattern is when price breaks out of the trendline.
This breakout represents not just a price movement, but a shift in the underlying balance of forces that has been building over time.
If trading volume decreases during the formation of the pattern and then increases at the moment of breakout, it suggests that market participants are committing to a new direction.
Conversely, a breakout without a corresponding increase in volume may be less reliable and could result in a false move.
After the breakout, price often retraces back toward the trendline.
This retest area can serve as a more stable entry point in the direction of the new trend.
🔹 How to Interpret Wedge Patterns
Wedge patterns are not just tools for predicting reversals—they are also useful for assessing the health of a trend.
When price continues moving in one direction but with decreasing volatility, it indicates that market conviction is weakening.
Therefore, wedges are more about identifying changes in momentum strength rather than simply predicting direction.
By understanding this, traders can better evaluate both the sustainability of the current trend and the likelihood of a reversal.