Orbis Securities Logo
Orbis
Trading
Markets
Trading Platforms
Partnership
Customer Service
LoginSign Up

© 2025 Orbis Securities

Legal Information

This website is owned and operated by Orbis Securities (Pty) Ltd, a Limited Liability Company incorporated under the laws of South Africa, with registration number 2024/224812/07 and registered office address at 18 Cavendish Road, Claremont, Cape Town, Western Cape 7708, South Africa. Orbis Securities (Pty) Ltd is regulated by the Financial Sector Conduct Authority (FSCA) of South Africa with regulatory number FSP 54619.

The physical office address at Office 218, 50 Long Street, Cape Town, 8001, South Africa.

Regional Restriction

Orbis Securities (Pty) Ltd does not provide services to individuals of U.S. nationality, residents or any persons residing in jurisdictions identified as restricted or sanctioned by international regulatory authorities. Restricted countries and sanctioned jurisdictions include Afghanistan, Belarus, Cuba, Iran, Iraq, North Korea, Libya, Russia, Somalia, Syria, Ukraine, Yemen. This list is non-exhaustive and may be updated from time to time to comply with evolving international laws and regulations. Information in this website and services also not use by any person in any country or jurisdiction where such distribution or use would be contrary and deemed unlawful to local law or regulation.

Risk Warnings

Trading Derivatives carries a high level of risk to your capital, and you should only trade with money you can afford to lose. Trading Derivatives may not be suitable for all investors, so please ensure that you fully understand the risks involved and seek independent advice if necessary. For further assistance, please contact our Customer Support Team: support@orbissecurities.com or contact us at ‪+27 10 288 2018‬.

Orbis

  • About Orbis
  • Why Orbis?
  • Licenses & Regulation
  • Legal Documents

Trading

  • Account Types
  • Trading Server
  • Deposit
  • Withdrawal
  • Trading Conditions
  • Spreads
  • Swap
  • Margin & Leverage
  • Dynamic Leverage
  • Market Calendars
  • Trading Hours
  • US Earnings
  • AU Earnings

Markets

  • Forex CFDs
  • Commodity CFDs
  • Index CFDs
  • Index CFD Dividends
  • Cryptocurrency CFDs
  • Share CFDs
  • Share CFD Margins
  • Contract Specifications

Trading Platforms

  • MetaTrader 4
  • MetaTrader 5

Partnership

  • Partnership Overview
  • Partnership Benefits

Customer Service

  • Notice
  • Help & Support
  • Account Opening Guide
  • MT4 User Guide
  • MT5 User Guide
  • Economic Calendar
  • Trading Education

© 2025 Orbis Securities

Legal Information

This website is owned and operated by Orbis Securities (Pty) Ltd, a Limited Liability Company incorporated under the laws of South Africa, with registration number 2024/224812/07 and registered office address at 18 Cavendish Road, Claremont, Cape Town, Western Cape 7708, South Africa. Orbis Securities (Pty) Ltd is regulated by the Financial Sector Conduct Authority (FSCA) of South Africa with regulatory number FSP 54619.

The physical office address at Office 218, 50 Long Street, Cape Town, 8001, South Africa.

Regional Restriction

Orbis Securities (Pty) Ltd does not provide services to individuals of U.S. nationality, residents or any persons residing in jurisdictions identified as restricted or sanctioned by international regulatory authorities. Restricted countries and sanctioned jurisdictions include Afghanistan, Belarus, Cuba, Iran, Iraq, North Korea, Libya, Russia, Somalia, Syria, Ukraine, Yemen. This list is non-exhaustive and may be updated from time to time to comply with evolving international laws and regulations. Information in this website and services also not use by any person in any country or jurisdiction where such distribution or use would be contrary and deemed unlawful to local law or regulation.

Risk Warnings

Trading Derivatives carries a high level of risk to your capital, and you should only trade with money you can afford to lose. Trading Derivatives may not be suitable for all investors, so please ensure that you fully understand the risks involved and seek independent advice if necessary. For further assistance, please contact our Customer Support Team: support@orbissecurities.com or contact us at ‪+27 10 288 2018‬.

>>>Finding Key Price Levels with Volume Profile

Finding Key Price Levels with Volume Profile

Discover how the Volume Profile tool helps traders identify key support and resistance zones by analyzing trading volume at specific price levels.

July 8, 2026
Finding Key Price Levels with Volume Profile

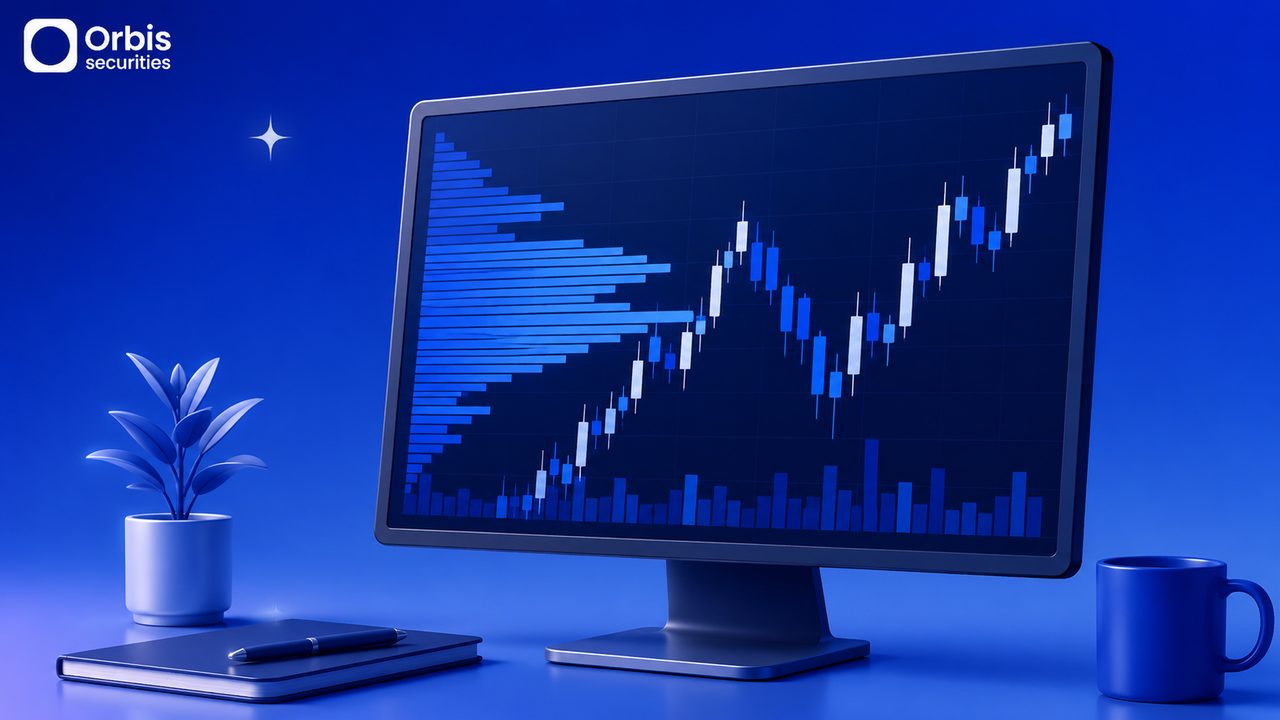
When analyzing financial markets, most traders are accustomed to looking at volume bars at the bottom of their charts. While this traditional method shows when trading activity occurred, it does not reveal the specific price levels where buyers and sellers were most active. To bridge this gap, experienced market participants often turn to an advanced analytical tool known as the Volume Profile.

Imagine entering a bustling marketplace where you can see not only the times of peak activity, but also the exact price tags that attracted the most transactions. By mapping trading volume horizontally across price levels rather than vertically over time, this tool provides a clearer picture of market consensus and potential areas of interest.


🔹 Understanding the Volume Profile Tool

Understanding the Volume Profile Tool

Unlike standard volume indicators that correspond to time intervals, the Volume Profile plots a horizontal histogram on the chart. This histogram represents the total volume traded at specific price levels over a designated timeframe. By looking at these horizontal bars, traders can easily spot which prices attracted the highest concentration of trading activity.

This tool is particularly useful for identifying the Value Area, which represents the price range where a significant majority of the trading volume took place. Recognizing these areas helps traders understand where the market has historically found fair value, offering clues about where price consolidation or breakouts might occur.


🔹 Key Elements to Watch

Key Elements to Watch

To effectively read a Volume Profile, traders focus on several critical reference points. The most prominent of these is the Point of Control (POC), which is the exact price level that registered the highest trading volume during the selected period. Because this level represents the peak of market agreement, the price often tends to gravitate back to it.

Additionally, the boundaries of the value area are marked by the Value Area High (VAH) and the Value Area Low (VAL). These levels indicate the outer edges of high-volume trading. When the price moves beyond these boundaries, it may suggest that the market is searching for new value, potentially leading to a sustained trend.


🔹 Integrating Volume Profile into Your Strategy

Integrating Volume Profile into Your Strategy

In practical trading, high-volume nodes often function as strong support and resistance zones. When the price approaches a historical Point of Control from above, it may find support as buyers step in at a price previously accepted as fair. Conversely, if the price approaches a high-volume node from below, it may encounter resistance.

While this tool offers valuable insights into market structure, it should not be viewed as a guaranteed predictor of future price direction. Market dynamics can change rapidly, and prices can easily slice through high-volume areas during strong news events. Therefore, combining this analysis with other indicators and maintaining strict risk management remains essential for any trading strategy.