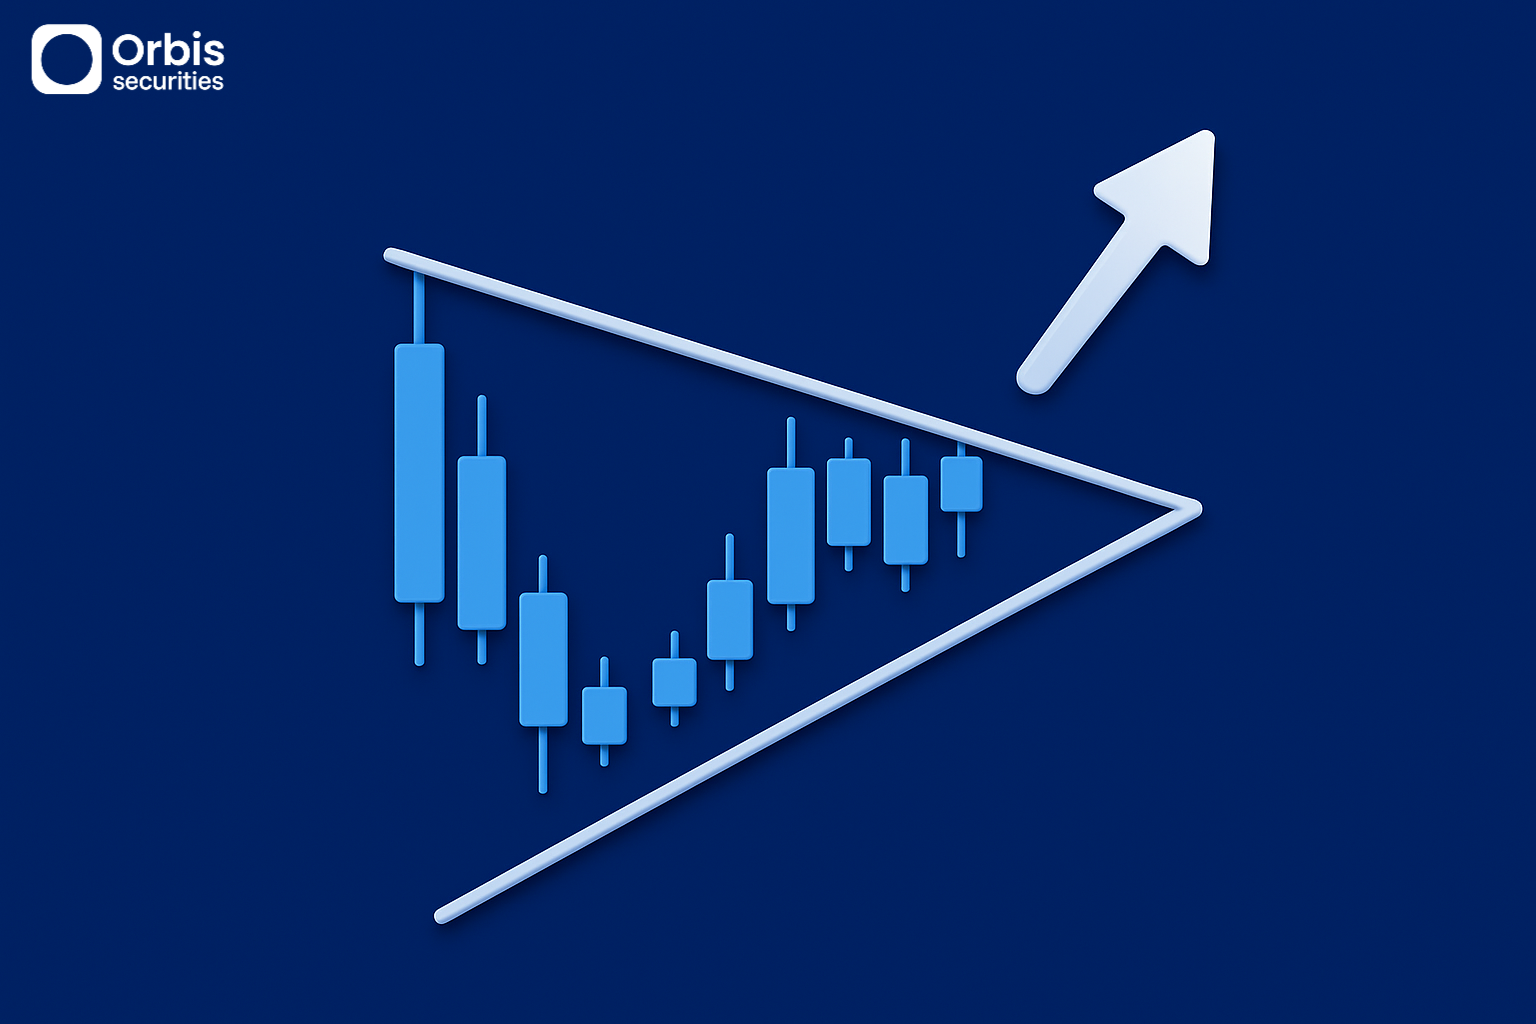
Price often moves in one direction for a period, then begins forming a range where highs become lower and lows become higher, gradually narrowing over time.
During this process, the chart forms a triangular shape, and the market enters a “pause phase” before deciding its next direction.
This structure is known as a triangle pattern, and it should not be seen as simple consolidation, but rather as a phase of energy buildup.
Although price movement appears to slow down, the market is actually compressing energy for its next move.
Once this compression ends, strong volatility often follows.
🔹 Why the Contraction Structure Forms
Triangle patterns form as buying and selling forces gradually reach equilibrium.
In an uptrend, buying pressure weakens over time, causing lower highs.
In a downtrend, selling pressure decreases, resulting in higher lows.
As these two forces converge, the price range becomes progressively narrower.
Over time, volatility decreases and trading volume often declines.
This reflects a state where market participants are uncertain about direction and are waiting on the sidelines.
However, this stagnation also suggests that a new directional move is likely to emerge.
🔹 The Moment of Breakout
The most important phase in a triangle pattern is when the two trendlines converge.
As price approaches this point, it becomes increasingly difficult to remain within the narrowing range, and eventually a breakout occurs in one direction.
This breakout is not just a simple price movement—it represents the release of accumulated energy.
When the breakout is accompanied by increased trading volume, it indicates a higher probability that the trend will continue in that direction.
After the breakout, price may retrace back toward the trendline before continuing.
This retest area is often used as a potential entry point in the direction of the new trend.
🔹 Interpreting Different Triangle Types
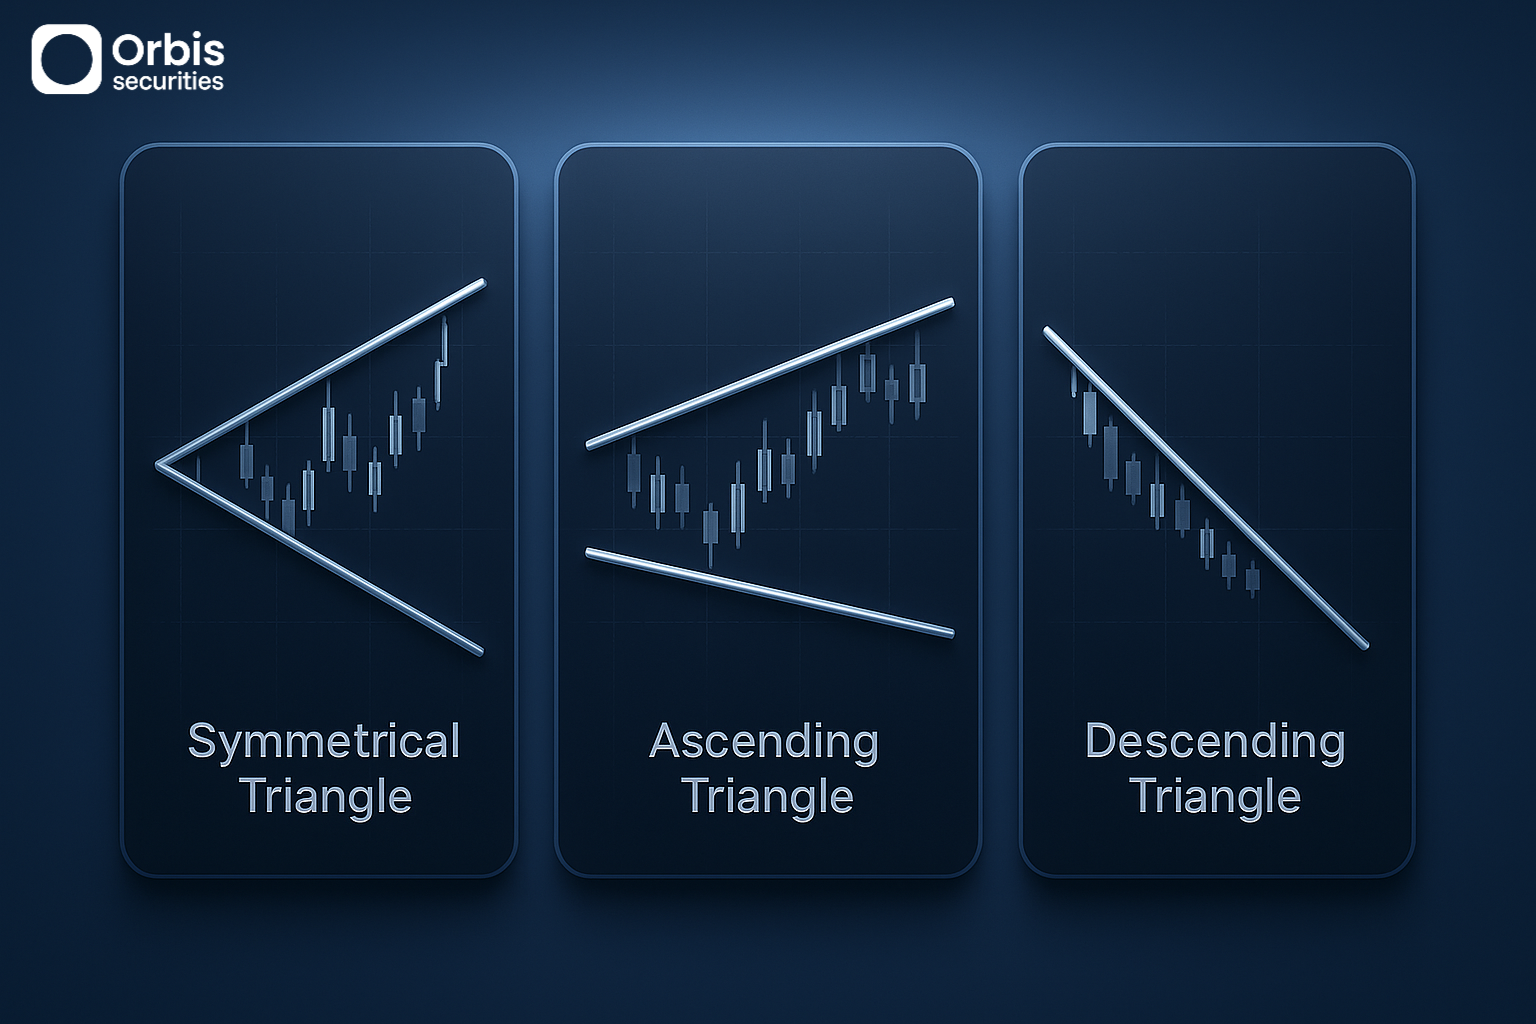
The shape of the triangle can provide insight into which side holds more strength.
If the upper boundary remains flat while lows continue to rise, it suggests increasing buying pressure.
Conversely, if the lower boundary holds while highs continue to decline, it indicates growing selling pressure.
In cases where both the upper and lower boundaries converge symmetrically, the market lacks a clear directional bias.
In such scenarios, it is difficult to predict direction until a breakout occurs.
🔹 Using Volatility as a Strategy
Triangle patterns are more useful for identifying when volatility will expand rather than predicting direction.
During periods of contraction, it is often better to avoid aggressive entries and wait for a confirmed breakout before following the move.
The longer the consolidation phase lasts, the more energy tends to build up.
As a result, breakouts that occur in the later stages of the pattern often lead to strong price movements within a short period.
For this reason, it is important to consider both the duration of the pattern and the degree of compression when analyzing potential breakout opportunities.