Orbis Securities Logo
Orbis
Trading
Markets
Trading Platforms
Partnership
Customer Service
LoginSign Up

© 2025 Orbis Securities

Legal Information

This website is owned and operated by Orbis Securities (Pty) Ltd, a Limited Liability Company incorporated under the laws of South Africa, with registration number 2024/224812/07 and registered office address at 18 Cavendish Road, Claremont, Cape Town, Western Cape 7708, South Africa. Orbis Securities (Pty) Ltd is regulated by the Financial Sector Conduct Authority (FSCA) of South Africa with regulatory number FSP 54619.

The physical office address at Office 218, 50 Long Street, Cape Town, 8001, South Africa.

Regional Restriction

Orbis Securities (Pty) Ltd does not provide services to individuals of U.S. nationality, residents or any persons residing in jurisdictions identified as restricted or sanctioned by international regulatory authorities. Restricted countries and sanctioned jurisdictions include Afghanistan, Belarus, Cuba, Iran, Iraq, North Korea, Libya, Russia, Somalia, Syria, Ukraine, Yemen. This list is non-exhaustive and may be updated from time to time to comply with evolving international laws and regulations. Information in this website and services also not use by any person in any country or jurisdiction where such distribution or use would be contrary and deemed unlawful to local law or regulation.

Risk Warnings

Trading Derivatives carries a high level of risk to your capital, and you should only trade with money you can afford to lose. Trading Derivatives may not be suitable for all investors, so please ensure that you fully understand the risks involved and seek independent advice if necessary. For further assistance, please contact our Customer Support Team: support@orbissecurities.com or contact us at ‪+27 10 288 2018‬.

Orbis

  • About Orbis
  • Why Orbis?
  • Licenses & Regulation
  • Legal Documents

Trading

  • Account Types
  • Trading Server
  • Deposit
  • Withdrawal
  • Trading Conditions
  • Spreads
  • Swap
  • Margin & Leverage
  • Dynamic Leverage
  • Market Calendars
  • Trading Hours
  • US Earnings
  • AU Earnings

Markets

  • Forex CFDs
  • Commodity CFDs
  • Index CFDs
  • Index CFD Dividends
  • Cryptocurrency CFDs
  • Share CFDs
  • Share CFD Margins
  • Contract Specifications

Trading Platforms

  • MetaTrader 4
  • MetaTrader 5

Partnership

  • Partnership Overview
  • Partnership Benefits

Customer Service

  • Notice
  • Help & Support
  • Account Opening Guide
  • MT4 User Guide
  • MT5 User Guide
  • Economic Calendar
  • Trading Education

© 2025 Orbis Securities

Legal Information

This website is owned and operated by Orbis Securities (Pty) Ltd, a Limited Liability Company incorporated under the laws of South Africa, with registration number 2024/224812/07 and registered office address at 18 Cavendish Road, Claremont, Cape Town, Western Cape 7708, South Africa. Orbis Securities (Pty) Ltd is regulated by the Financial Sector Conduct Authority (FSCA) of South Africa with regulatory number FSP 54619.

The physical office address at Office 218, 50 Long Street, Cape Town, 8001, South Africa.

Regional Restriction

Orbis Securities (Pty) Ltd does not provide services to individuals of U.S. nationality, residents or any persons residing in jurisdictions identified as restricted or sanctioned by international regulatory authorities. Restricted countries and sanctioned jurisdictions include Afghanistan, Belarus, Cuba, Iran, Iraq, North Korea, Libya, Russia, Somalia, Syria, Ukraine, Yemen. This list is non-exhaustive and may be updated from time to time to comply with evolving international laws and regulations. Information in this website and services also not use by any person in any country or jurisdiction where such distribution or use would be contrary and deemed unlawful to local law or regulation.

Risk Warnings

Trading Derivatives carries a high level of risk to your capital, and you should only trade with money you can afford to lose. Trading Derivatives may not be suitable for all investors, so please ensure that you fully understand the risks involved and seek independent advice if necessary. For further assistance, please contact our Customer Support Team: support@orbissecurities.com or contact us at ‪+27 10 288 2018‬.

>>>Identifying Reversal Points with the Head and Shoulders Pattern

Identifying Reversal Points with the Head and Shoulders Pattern

Learn the structure and application of one of the most well-known trend reversal patterns.

April 17, 2026
image.png

Markets do not move in a single direction forever.
Even during sustained uptrends, there comes a point where momentum weakens, and downtrends also eventually reach turning points.

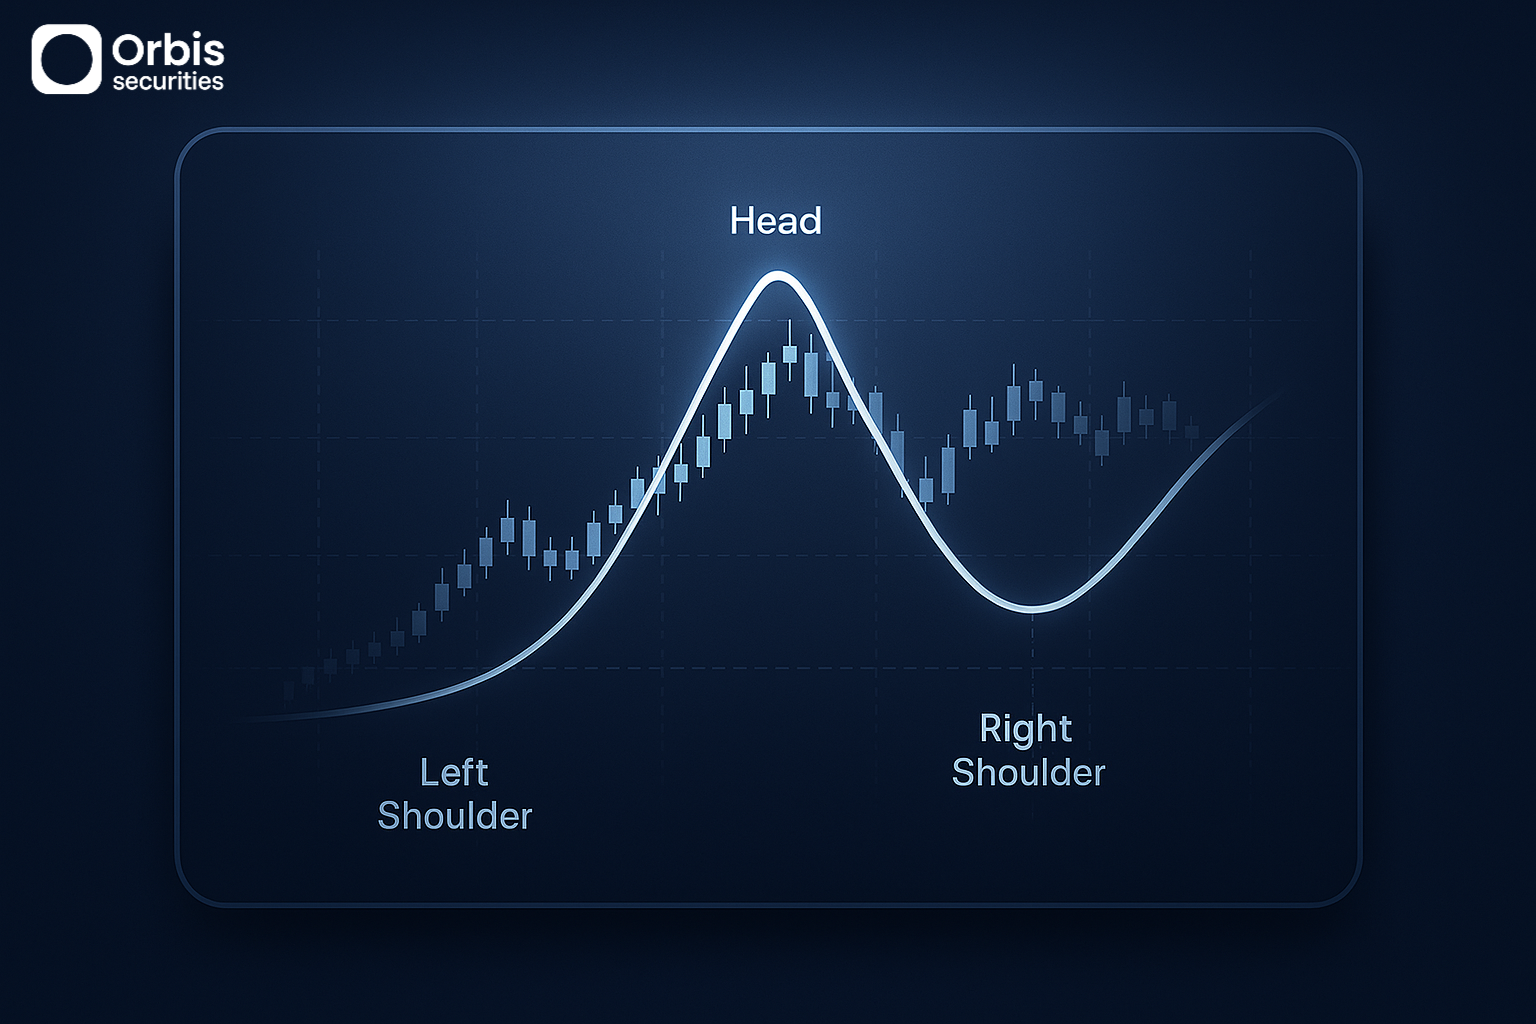
One of the most recognizable patterns that visually represents these turning points is
the Head and Shoulders pattern.

This pattern is not just a shape—it illustrates the gradual weakening of an uptrend step by step.

For this reason, traders interpret it not merely as a chart formation, but as a signal of a potential trend reversal.


🔹 How the Pattern Forms

The Head and Shoulders pattern typically forms at the final stage of an uptrend.

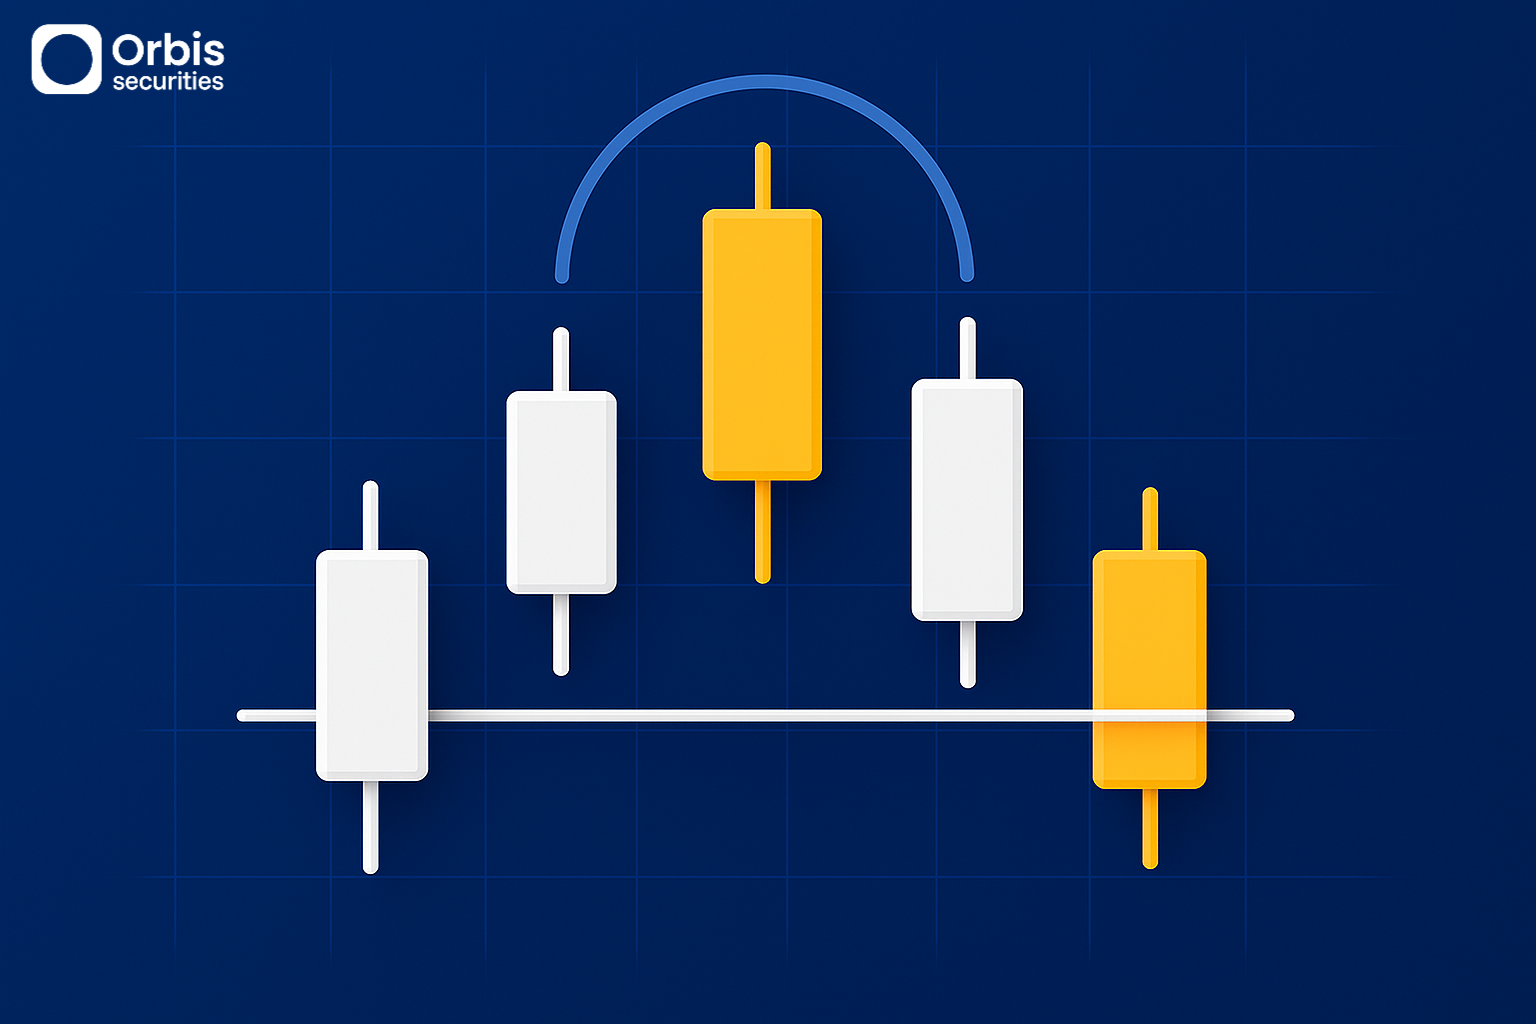
At first, within a normal upward movement, a peak forms followed by a pullback.
Then, the price rises again to form a higher high, suggesting the uptrend is continuing.

However, during this second rise, momentum often weakens compared to the previous move, and trading volume tends to decrease.

In the third rise, the peak forms lower than the previous high.
This indicates that buying pressure is no longer strong enough to push prices higher.

As this sequence of lower highs develops, upward momentum fades, and the market begins transitioning toward a potential reversal.

A key element in this structure is the neckline.
This line is drawn by connecting the lows formed during the pullbacks, acting as a support level.

When price breaks below this neckline, it signals that the uptrend may have ended and a new downtrend could begin.


🔹 When the Trend Reversal Is Confirmed

The Head and Shoulders pattern is not confirmed simply by its shape.

The key factor is whether the neckline is actually broken.

When price clearly breaks below this support level, the existing uptrend structure fails, and the market transitions into a new phase.

If this breakdown is accompanied by increased trading volume, it suggests that real selling pressure is entering the market, strengthening the signal.

After the neckline break, price may retest the same level before continuing lower.
This retest area is often used as a potential entry point in the direction of the new trend.


🔹 The Inverse Head and Shoulders Pattern

image.png

While the Head and Shoulders pattern appears at the end of an uptrend, its inverse form appears at the end of a downtrend.

The Inverse Head and Shoulders pattern shows a shift where lower lows begin to turn into higher lows, indicating that selling pressure is weakening.

In this case as well, the key is the breakout of the neckline.

When price breaks above the resistance level, it signals that the downtrend may be ending and a new uptrend could begin.

If this breakout is accompanied by increasing volume, the reliability of the signal is further strengthened.


🔹 How to Interpret the Pattern

The Head and Shoulders pattern should not be judged solely by its appearance—it is important to interpret the underlying structure.

Traders should analyze how momentum weakens during the uptrend, how the structure of highs and lows changes, and how trading volume behaves throughout the pattern.

Additionally, the location of the pattern is crucial.

When it appears after a strong and extended uptrend, it carries greater significance as a reversal signal.
However, if it forms without a clear preceding trend, it may simply represent temporary volatility rather than a meaningful reversal.​