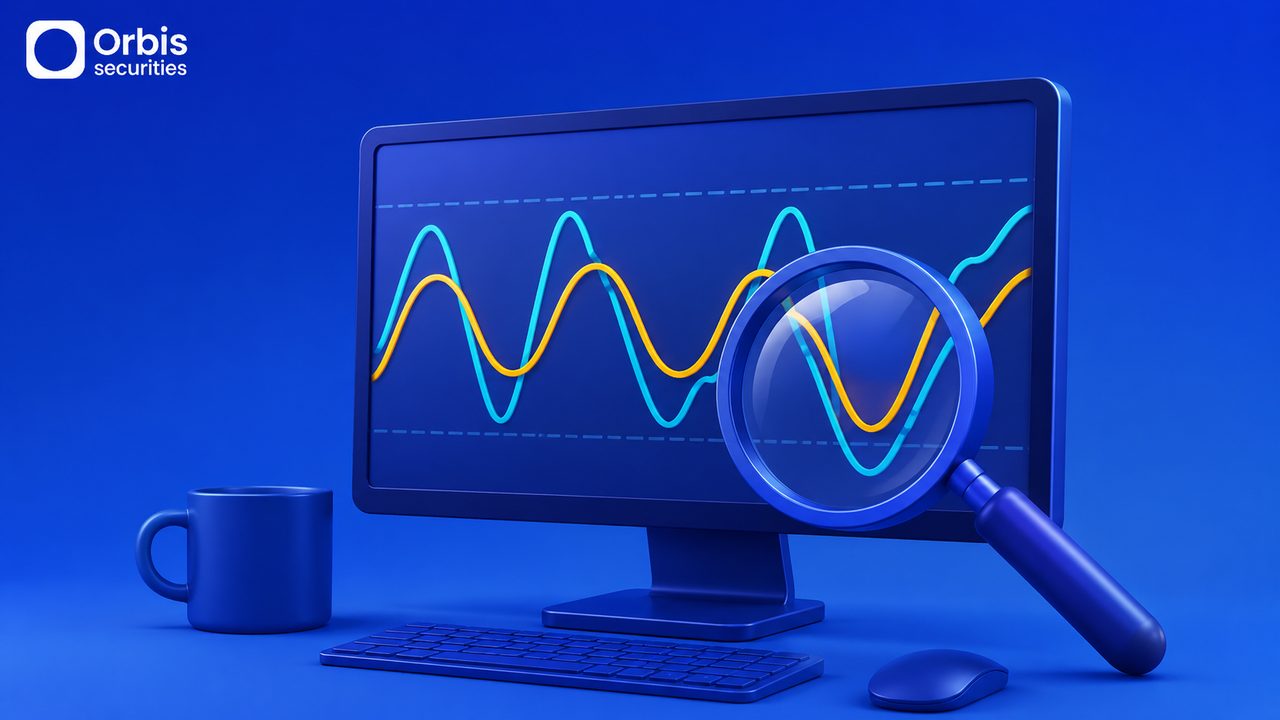
Imagine riding a swing. At its highest peak, it pauses momentarily before falling back down. In the financial markets, prices often exhibit similar momentum shifts. The Stochastic Oscillator is a popular technical tool designed to help traders visualize these momentum changes by identifying potential overbought and oversold areas.
Developed decades ago, this momentum indicator compares a security's closing price to its price range over a specific period. By learning how to read its movements, beginners can gain valuable insights into market dynamics and spot potential turning points.
🔹 Core Components of the Stochastic Oscillator

The Stochastic Oscillator consists of two main lines, typically referred to as %K and %D, which fluctuate within a scale of 0 to 100. The %K line represents the current market rate for the currency pair, while the %D line is a moving average of the %K line.
Traders generally look at specific threshold levels to gauge market conditions. The standard settings define the area above 80 as the overbought zone, suggesting the price is near the top of its recent range, while the area below 20 is considered the oversold zone.
🔹 Identifying Overbought and Oversold Zones
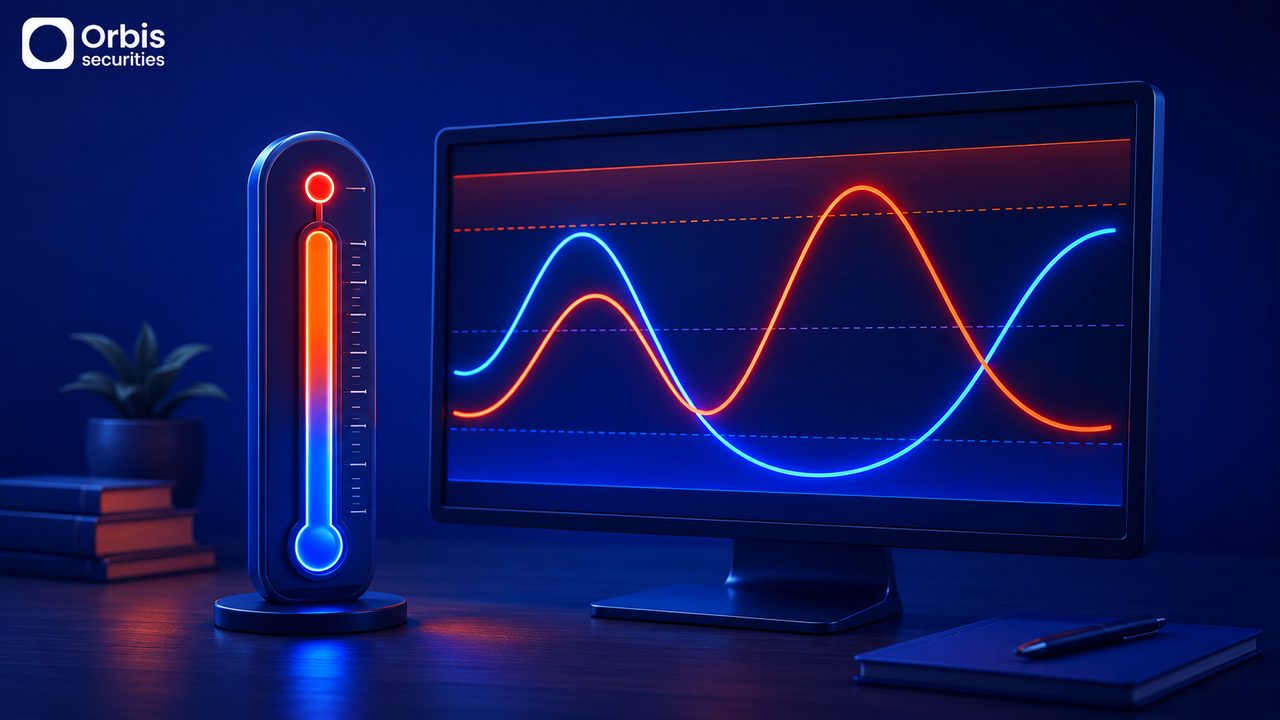
When the Stochastic lines rise above the 80 level, the market is considered overbought. This signals that buying pressure may be reaching its limit, and a downward correction could potentially occur. However, prices can remain high during strong uptrends.
Conversely, when the lines fall below 20, the market is in an oversold condition. This indicates that selling pressure might be exhausted, presenting a possibility for an upward rebound. Caution is required as markets can stay oversold during powerful downtrends.
🔹 Practical Tips and Risk Management

Relying solely on Stochastic signals can lead to false breakouts. To improve analysis, traders often combine it with other tools like trendlines, moving averages, or support levels to filter out market noise and confirm potential setups.
It is crucial to remember that no technical indicator is correct all the time. Implementing proper risk management strategies, such as setting stop-loss orders and practicing on a demo account, is essential to protect your trading capital.