Price is not just a number moving up and down—it reflects the balance between buying and selling pressure.
RSI (Relative Strength Index) is an indicator that expresses the strength of this balance in numerical form.
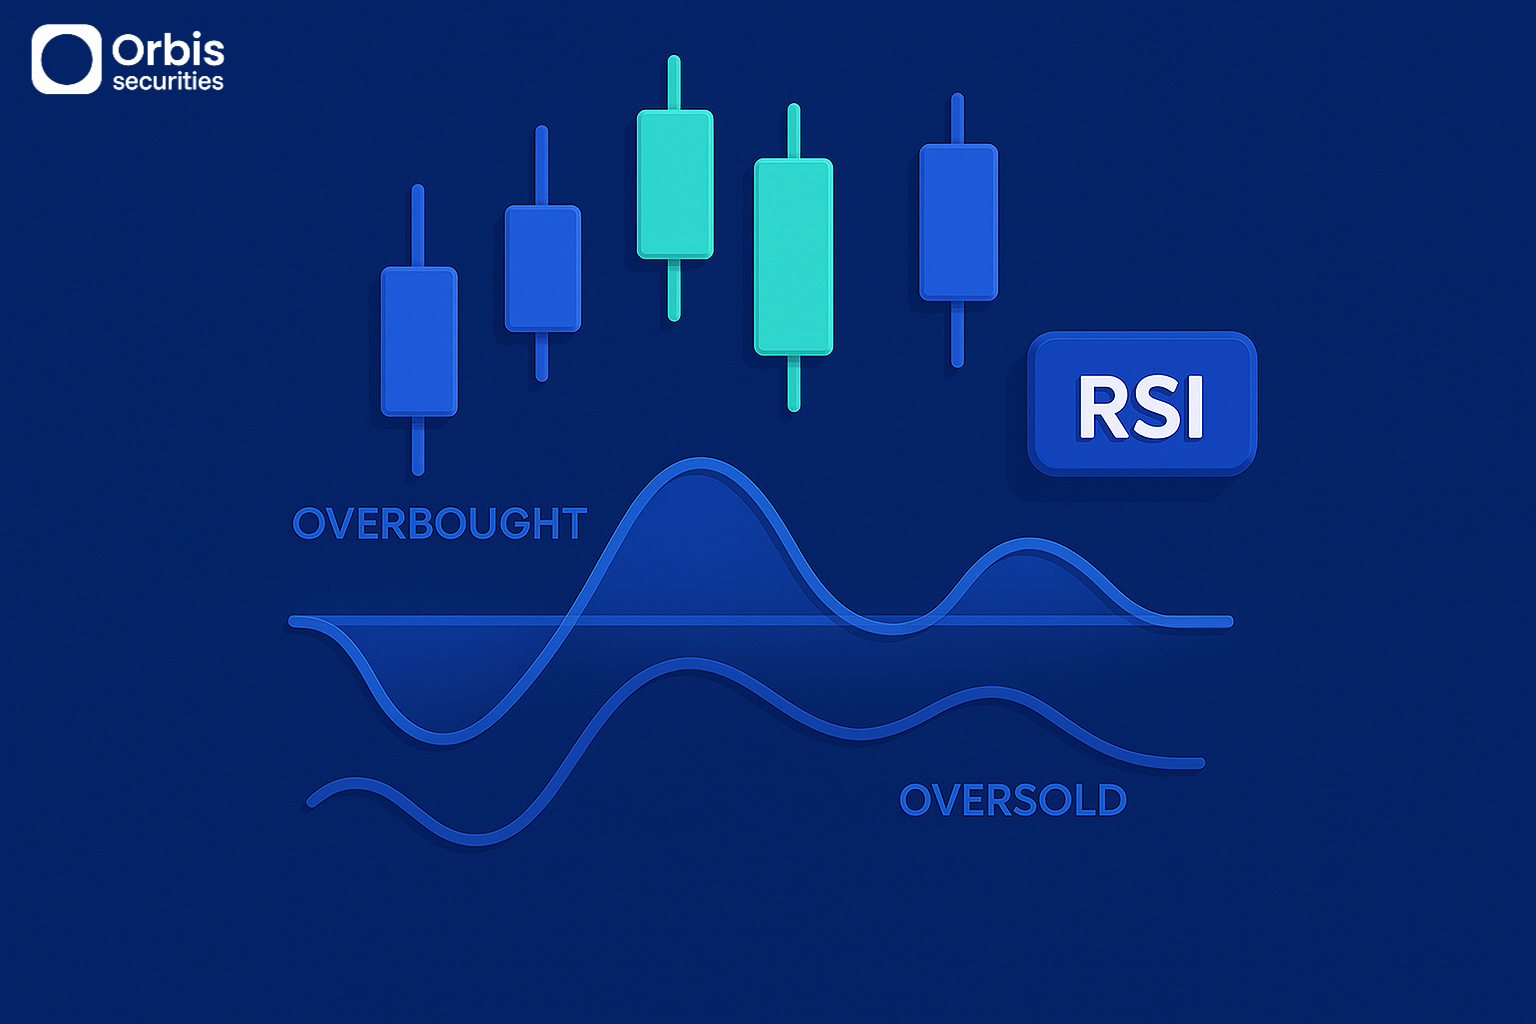
RSI compares upward and downward pressure to determine whether the market is in an overbought or oversold condition.
🔹 Basic Structure of RSI
RSI is calculated by averaging the magnitude of price increases and decreases over a set period and comparing their relative strength.
It is typically calculated using a 14-period setting.
When upward momentum is stronger, the RSI value rises; when downward momentum dominates, the value falls.
The indicator ranges from 0 to 100.
Generally, values above 70 are considered overbought, while values below 30 are considered oversold.
However, these levels should not be seen as absolute signals, but rather as reference points for understanding current market conditions.
🔹 Meaning of Overbought and Oversold Levels
When RSI is in a high range, it indicates that the upward trend has continued for a certain period.
In such cases, there is a higher probability of profit-taking, and the price may enter a short-term correction phase.
Conversely, when RSI is in a low range, it suggests that selling pressure has been excessive, and a short-term rebound may be possible.
However, these interpretations must always be considered alongside the trend.
In strong uptrends, RSI can remain at high levels for an extended period.
Similarly, in downtrends, RSI may stay in low territory without quickly recovering.
Therefore, it is important to interpret RSI not just by its value, but in the context of the overall market direction.
🔹 How to Use RSI
RSI becomes more meaningful when combined with overall market trends rather than used alone.
In an uptrend, temporary dips in RSI can be interpreted as pullback opportunities.
In a downtrend, RSI rebounds may be used as potential selling opportunities.
RSI can also signal potential trend changes through its relationship with price.
For example, if the price continues to rise while RSI forms lower highs, it may indicate weakening upward momentum.
Conversely, if the price declines while RSI forms higher lows, it may suggest that selling pressure is easing.
Such patterns are often used as early signals of a potential trend reversal.
🔹 Key Considerations When Interpreting RSI
Although RSI has a simple structure, its interpretation can vary depending on market conditions.
In strong uptrends, prices may continue to rise even in overbought conditions.
In prolonged downtrends, oversold conditions may persist for extended periods.
The sensitivity of RSI also changes depending on the chosen period.
Shorter periods make the indicator more responsive to price changes, producing faster signals,
while longer periods result in smoother and more stable movements.
For this reason, RSI should not be used in isolation.
Combining it with trendlines, trading volume, and other indicators leads to more reliable analysis.