Orbis Securities Logo
Orbis
Trading
Markets
Trading Platforms
Partnership
Customer Service
LoginSign Up

© 2025 Orbis Securities

Legal Information

This website is owned and operated by Orbis Securities (Pty) Ltd, a Limited Liability Company incorporated under the laws of South Africa, with registration number 2024/224812/07 and registered office address at 18 Cavendish Road, Claremont, Cape Town, Western Cape 7708, South Africa. Orbis Securities (Pty) Ltd is regulated by the Financial Sector Conduct Authority (FSCA) of South Africa with regulatory number FSP 54619.

The physical office address at Office 218, 50 Long Street, Cape Town, 8001, South Africa.

Regional Restriction

Orbis Securities (Pty) Ltd does not provide services to individuals of U.S. nationality, residents or any persons residing in jurisdictions identified as restricted or sanctioned by international regulatory authorities. Restricted countries and sanctioned jurisdictions include Afghanistan, Belarus, Cuba, Iran, Iraq, North Korea, Libya, Russia, Somalia, Syria, Ukraine, Yemen. This list is non-exhaustive and may be updated from time to time to comply with evolving international laws and regulations. Information in this website and services also not use by any person in any country or jurisdiction where such distribution or use would be contrary and deemed unlawful to local law or regulation.

Risk Warnings

Trading Derivatives carries a high level of risk to your capital, and you should only trade with money you can afford to lose. Trading Derivatives may not be suitable for all investors, so please ensure that you fully understand the risks involved and seek independent advice if necessary. For further assistance, please contact our Customer Support Team: support@orbissecurities.com or contact us at ‪+27 10 288 2018‬.

Orbis

  • About Orbis
  • Why Orbis?
  • Licenses & Regulation
  • Legal Documents

Trading

  • Account Types
  • Trading Server
  • Deposit
  • Withdrawal
  • Trading Conditions
  • Spreads
  • Swap
  • Margin & Leverage
  • Dynamic Leverage
  • Market Calendars
  • Trading Hours
  • US Earnings
  • AU Earnings

Markets

  • Forex CFDs
  • Commodity CFDs
  • Index CFDs
  • Index CFD Dividends
  • Cryptocurrency CFDs
  • Share CFDs
  • Share CFD Margins
  • Contract Specifications

Trading Platforms

  • MetaTrader 4
  • MetaTrader 5

Partnership

  • Partnership Overview
  • Partnership Benefits

Customer Service

  • Notice
  • Help & Support
  • Account Opening Guide
  • MT4 User Guide
  • MT5 User Guide
  • Economic Calendar
  • Trading Education

© 2025 Orbis Securities

Legal Information

This website is owned and operated by Orbis Securities (Pty) Ltd, a Limited Liability Company incorporated under the laws of South Africa, with registration number 2024/224812/07 and registered office address at 18 Cavendish Road, Claremont, Cape Town, Western Cape 7708, South Africa. Orbis Securities (Pty) Ltd is regulated by the Financial Sector Conduct Authority (FSCA) of South Africa with regulatory number FSP 54619.

The physical office address at Office 218, 50 Long Street, Cape Town, 8001, South Africa.

Regional Restriction

Orbis Securities (Pty) Ltd does not provide services to individuals of U.S. nationality, residents or any persons residing in jurisdictions identified as restricted or sanctioned by international regulatory authorities. Restricted countries and sanctioned jurisdictions include Afghanistan, Belarus, Cuba, Iran, Iraq, North Korea, Libya, Russia, Somalia, Syria, Ukraine, Yemen. This list is non-exhaustive and may be updated from time to time to comply with evolving international laws and regulations. Information in this website and services also not use by any person in any country or jurisdiction where such distribution or use would be contrary and deemed unlawful to local law or regulation.

Risk Warnings

Trading Derivatives carries a high level of risk to your capital, and you should only trade with money you can afford to lose. Trading Derivatives may not be suitable for all investors, so please ensure that you fully understand the risks involved and seek independent advice if necessary. For further assistance, please contact our Customer Support Team: support@orbissecurities.com or contact us at ‪+27 10 288 2018‬.

>>>Mastering MACD: Practical Trading Applications

Mastering MACD: Practical Trading Applications

Learn how to use MACD to read both trend and momentum.

April 17, 2026
image.png

Price movements are not just about going up or down—they also reflect how strongly the market is moving.
This concept is known as momentum, and one of the most widely used indicators to visualize it is
MACD.

MACD is based on the relationship between moving averages, allowing traders to assess market direction, speed, and potential trend reversals at the same time.

For this reason, traders use MACD not just as a simple indicator, but as a framework for interpreting market behavior.


🔹 Structure of MACD

MACD is calculated using the difference between a short-term and a long-term moving average.

Typically, it uses the 12-period and 26-period exponential moving averages (EMA), and the difference between these two forms the MACD line.
A signal line, which smooths the MACD line, is then added, and the gap between the two is visualized as a histogram.

Through this structure, MACD provides insight not only into direction but also into the strength of a trend.

When moving averages converge, it indicates weakening momentum, while divergence suggests strengthening trends.


🔹 Identifying Trend Reversals

One of the most common MACD signals is the crossover between the MACD line and the signal line.

When the MACD line crosses above the signal line, it suggests a potential bullish reversal.
When it crosses below, it indicates a potential bearish reversal.

However, these signals should not be used as standalone entry triggers.
Rather, they are better understood as indications that the market direction may be shifting.

In strong trending markets, the price often continues moving in the same direction even after a crossover.
Therefore, it is important to observe not just the crossover itself, but also the price behavior that follows.


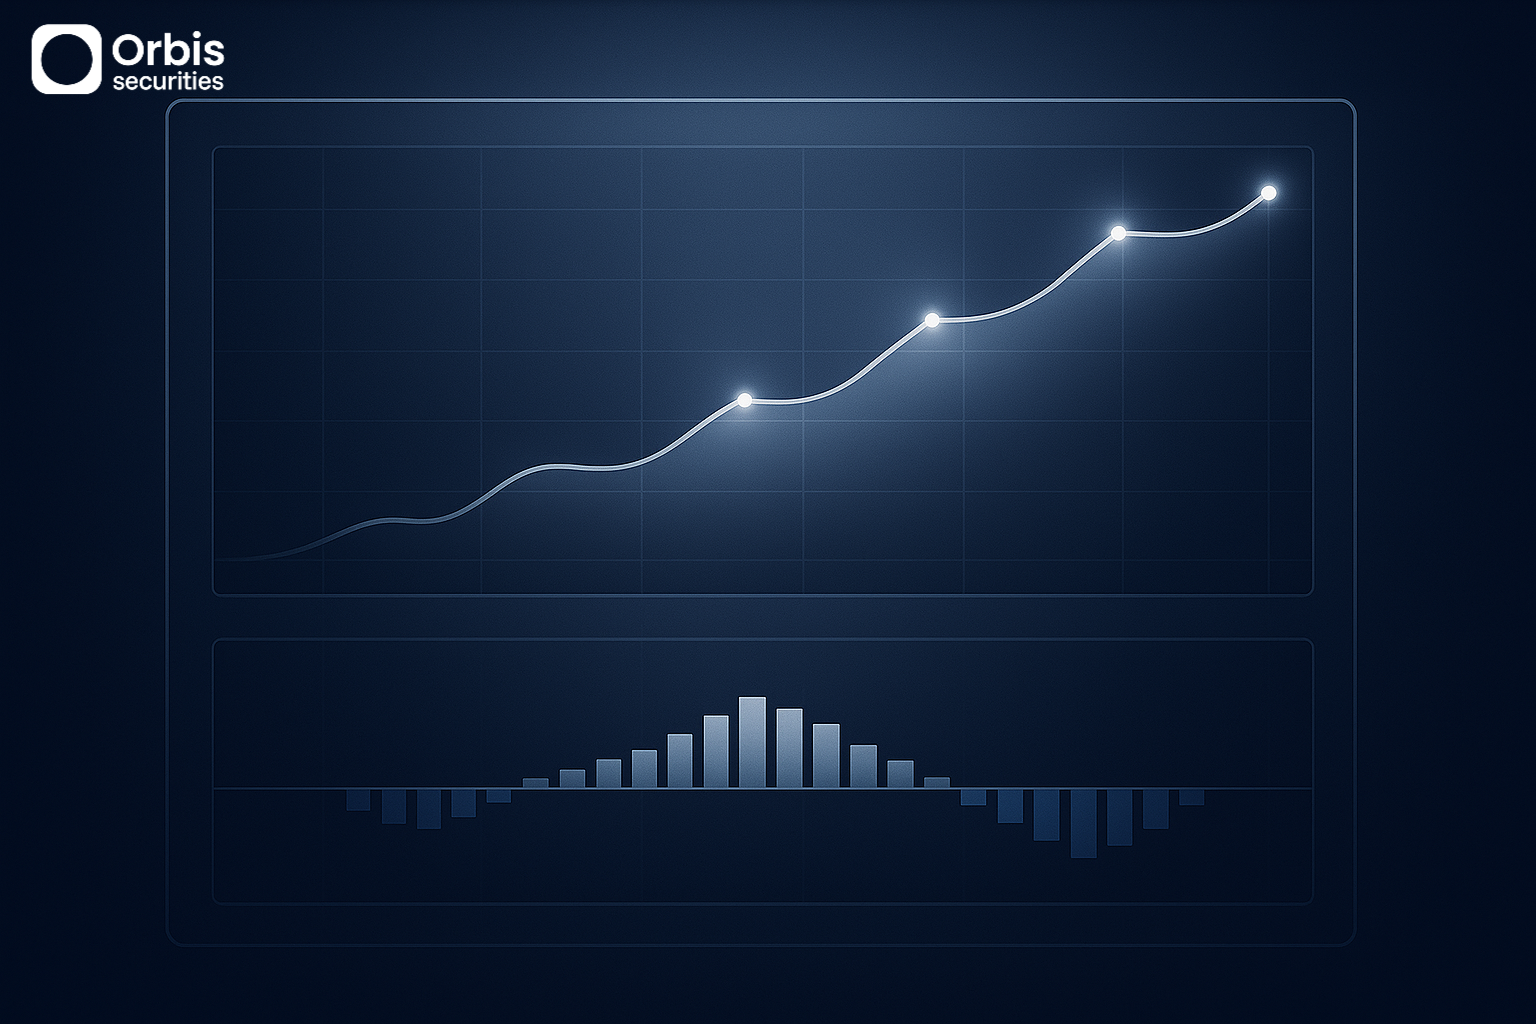
🔹 Using the Histogram to Read Momentum

Another key component of MACD is the histogram.

The histogram visually represents the distance between the MACD line and the signal line, providing insight into the speed and strength of the trend.

When the histogram expands, it indicates that momentum is increasing.
When it contracts, it suggests that momentum is weakening.

In particular, when the histogram shifts from expansion to contraction, it often signals that the market is losing strength—this can be an early sign of a potential trend change.


🔹 Detecting Trend Changes with Divergence

image.png

MACD can also be used to anticipate trend changes by comparing its movement with price.

If the price is rising while MACD forms lower highs, it may indicate weakening bullish momentum.
Conversely, if the price is falling while MACD forms higher lows, it suggests that bearish pressure is decreasing.

These patterns often appear before a full trend reversal, making them useful as early warning signals.

However, in shorter timeframes, such signals can be noisy.
They tend to be more reliable when confirmed over longer timeframes.


🔹 Key Principles for Interpreting MACD

MACD should not be interpreted based on a single signal.
Instead, it is important to combine multiple elements.

The crossover indicates a change in direction, the histogram shows the strength of the trend, and the relationship with price reveals whether the trend is continuing or weakening.

By analyzing these three aspects together, traders can better distinguish between a simple correction and a true trend reversal.

This comprehensive approach is especially important in highly volatile markets, where more structured analysis leads to more stable decision-making.​